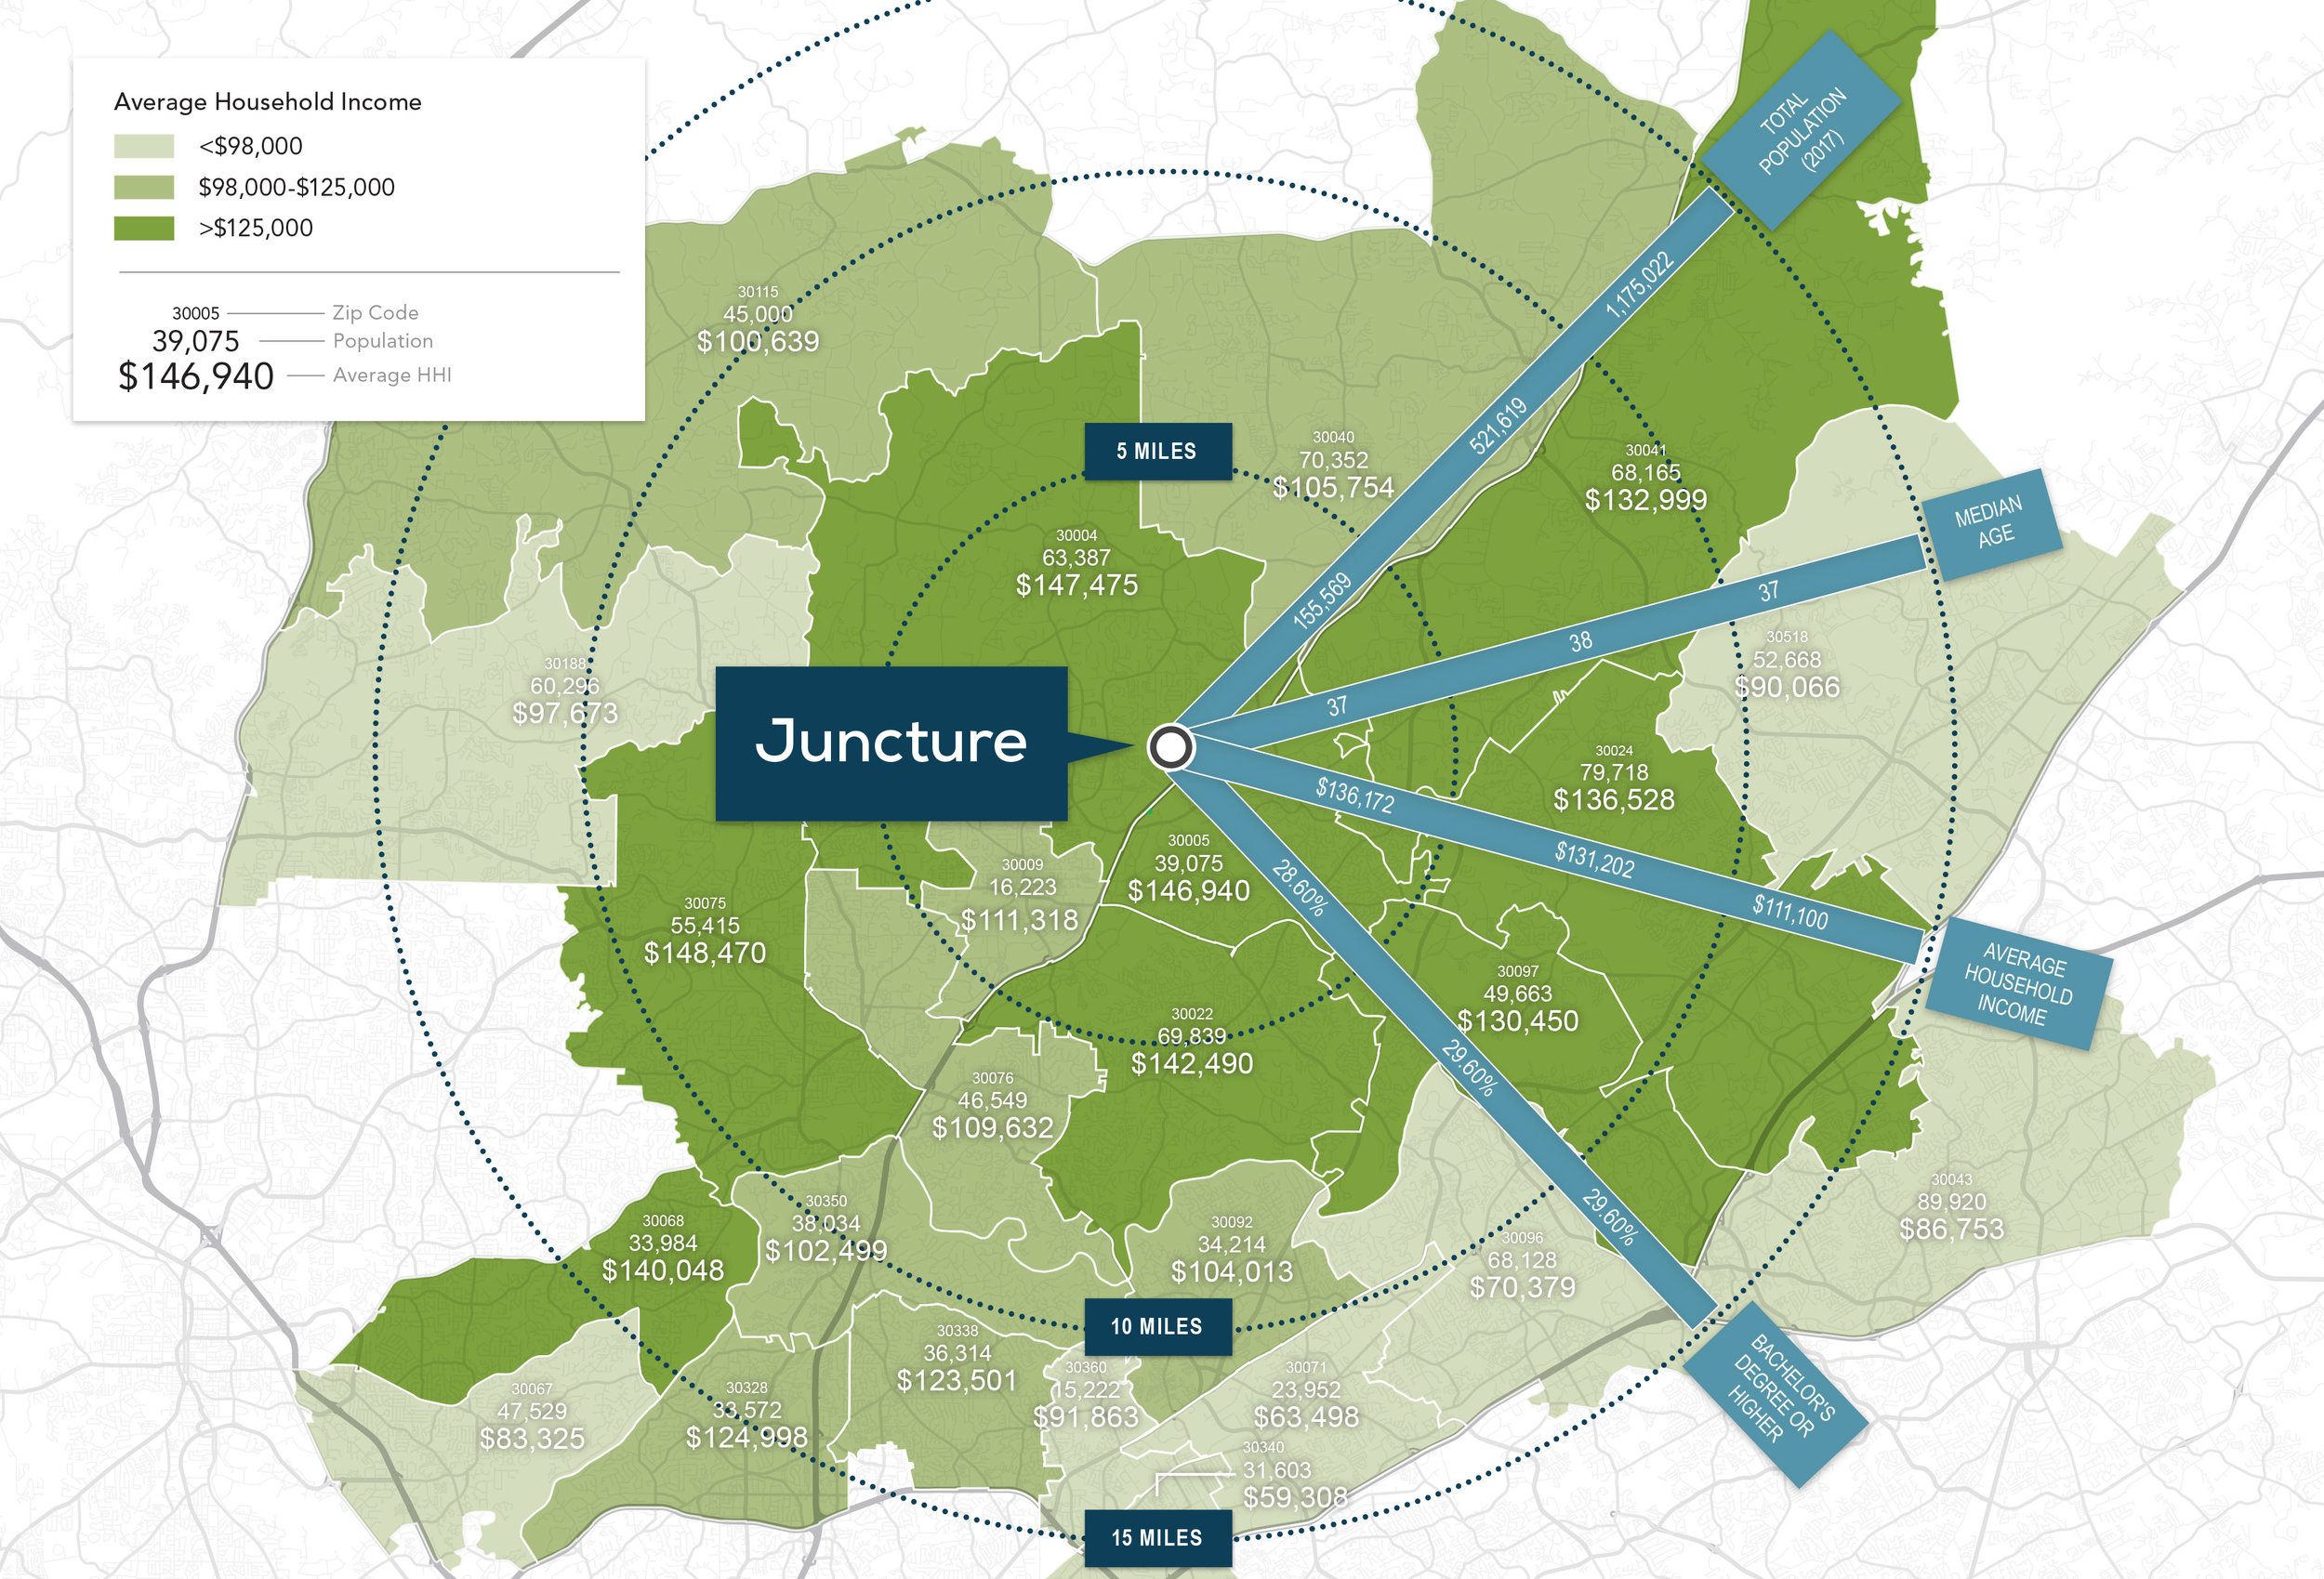
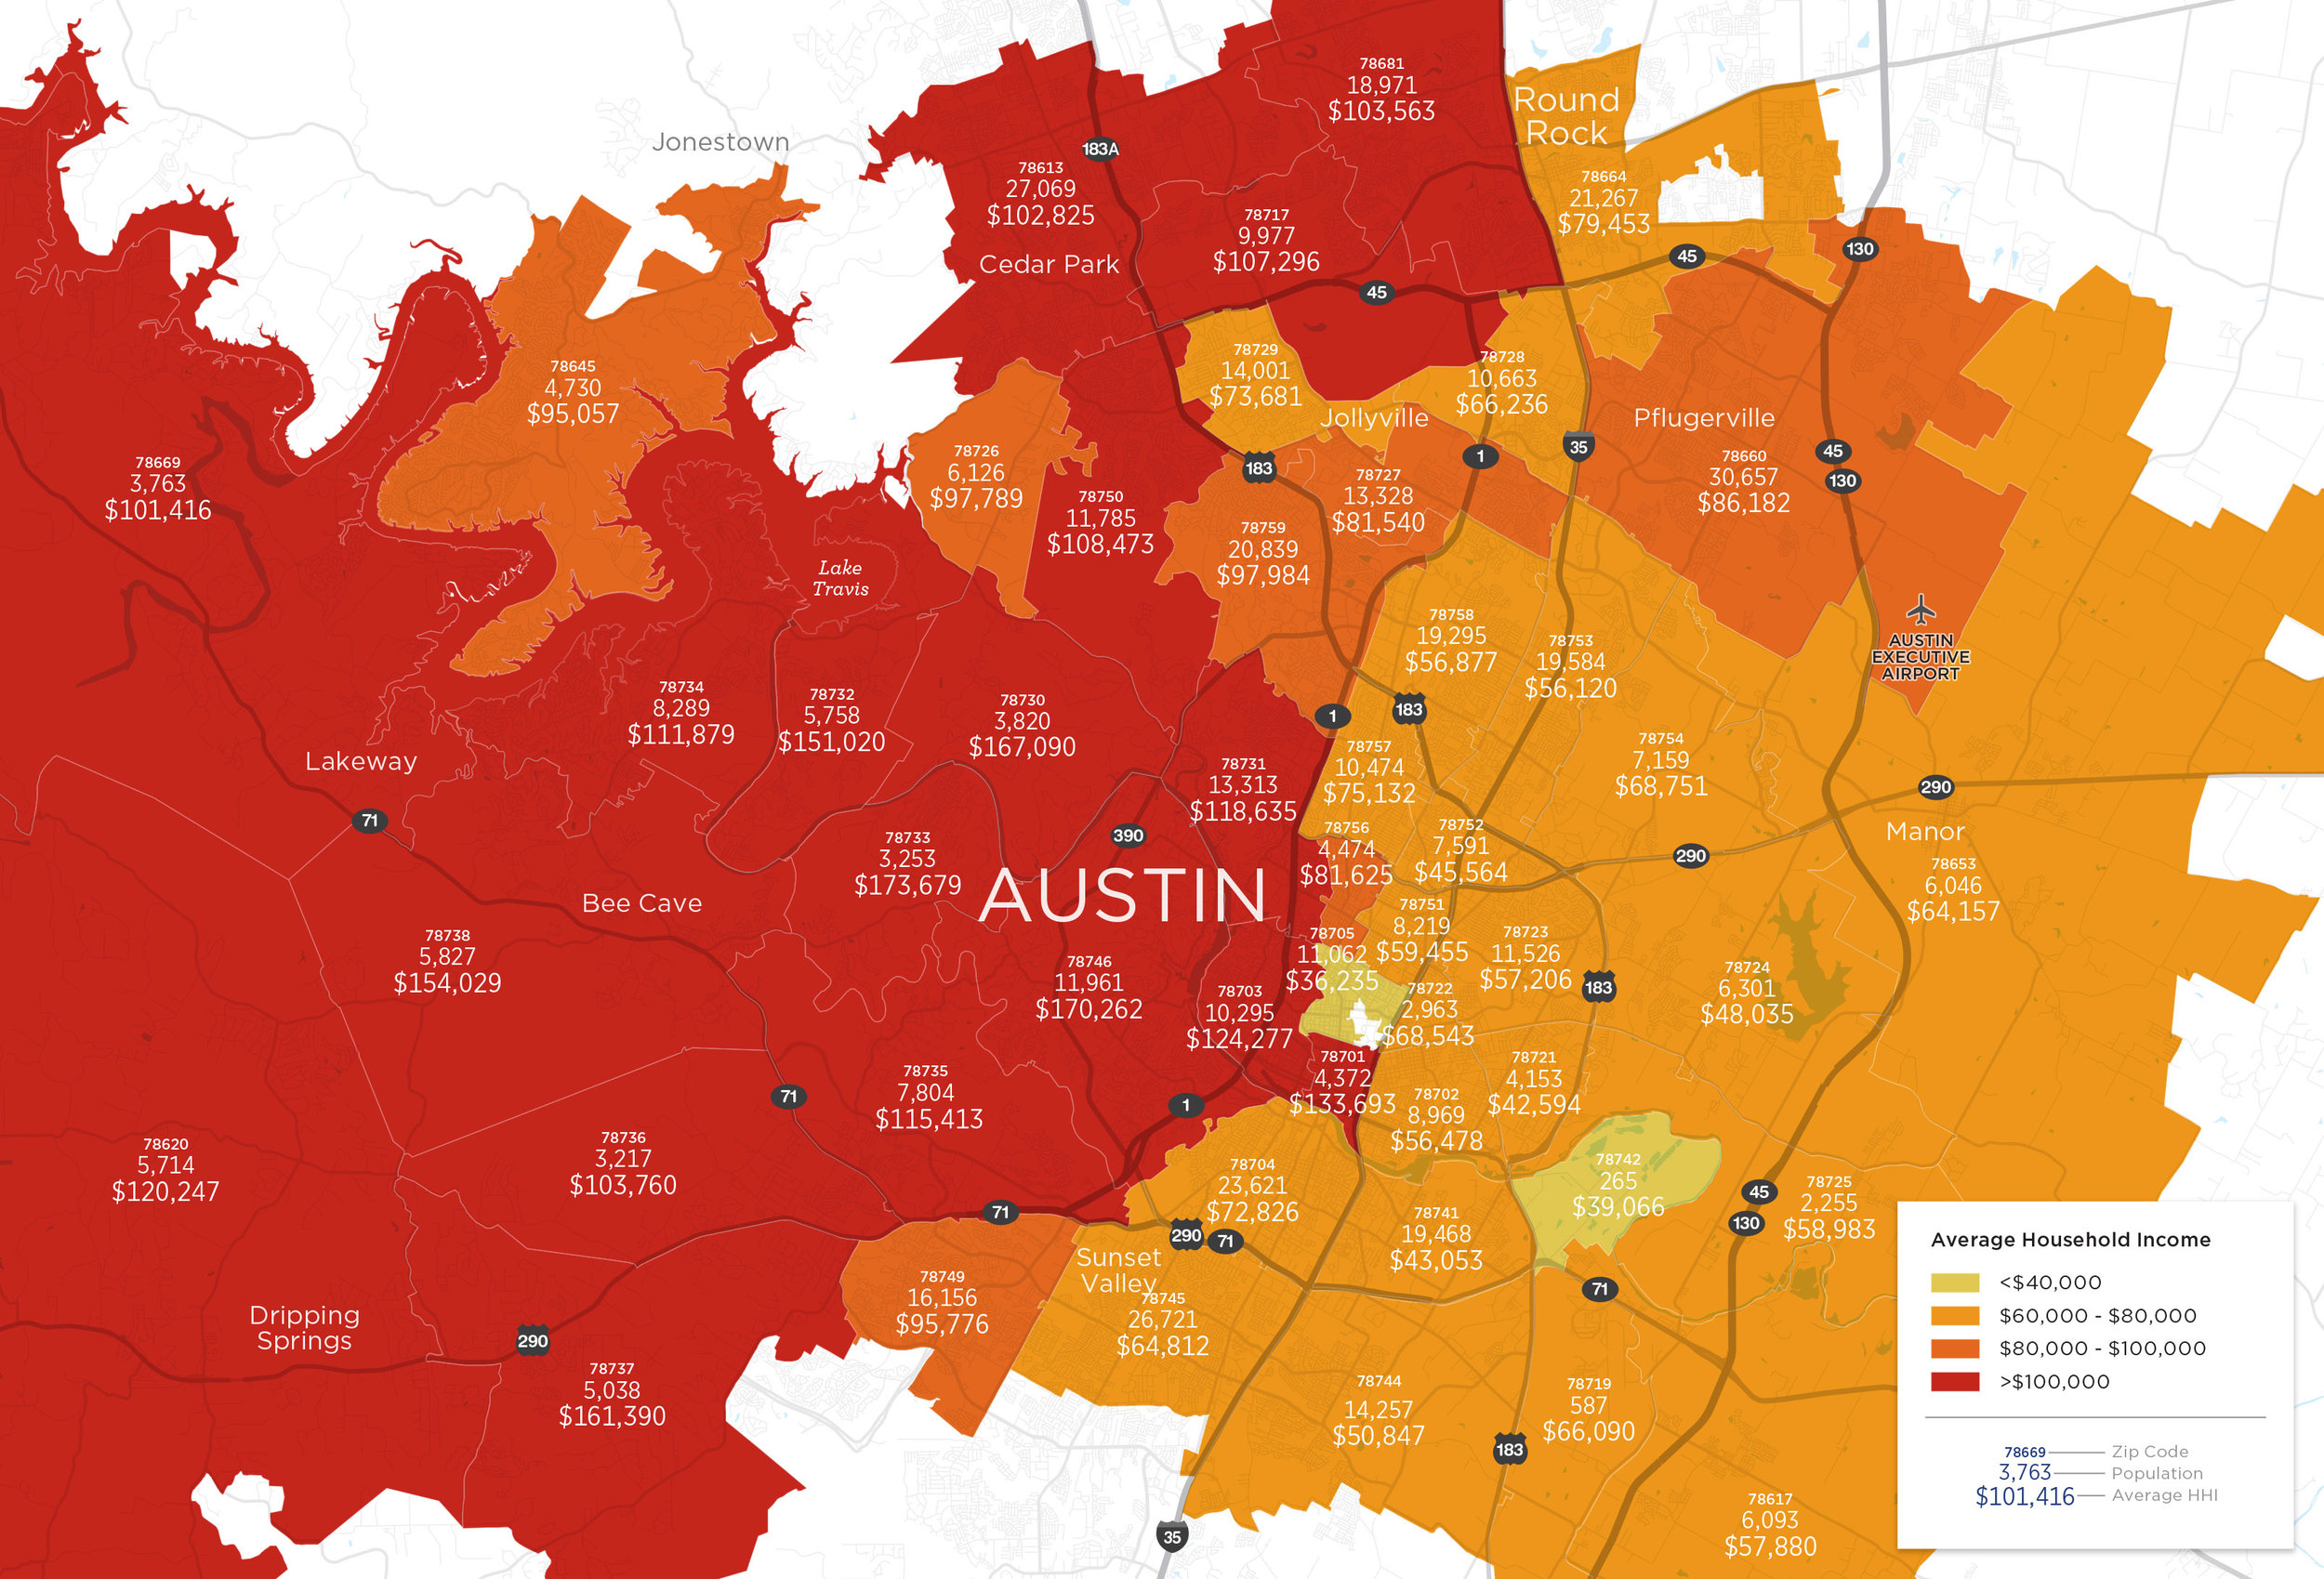
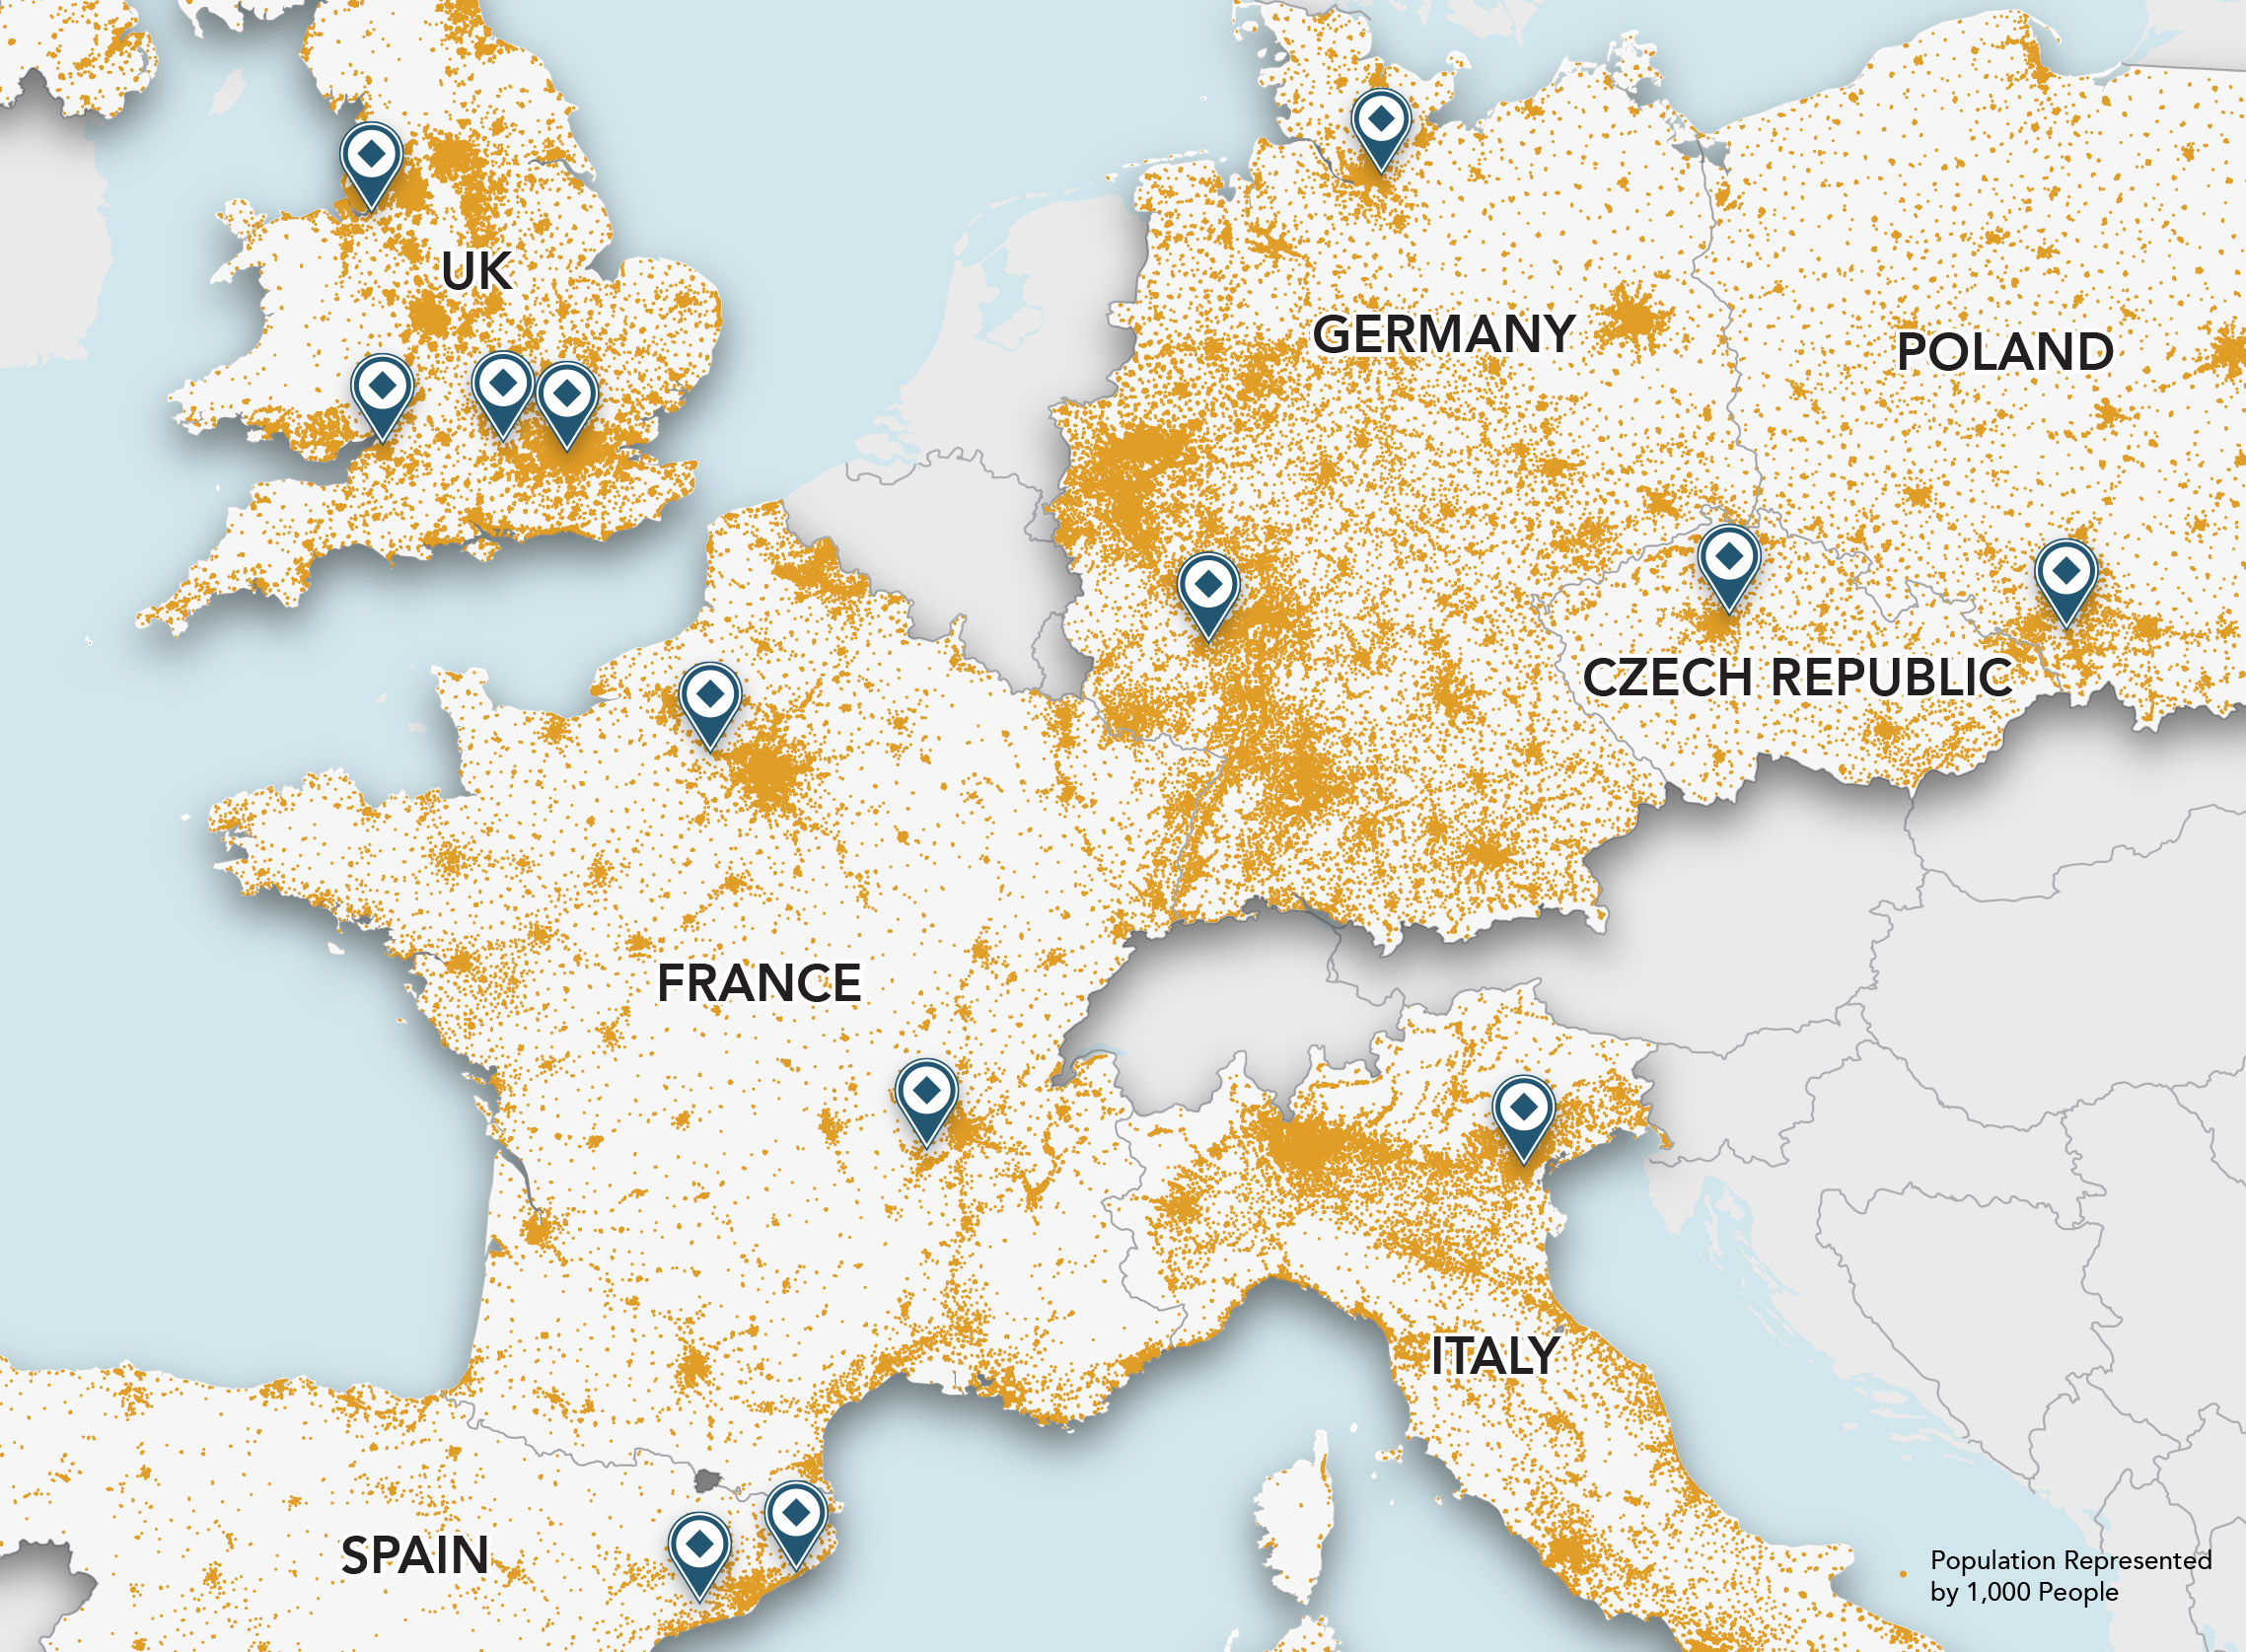
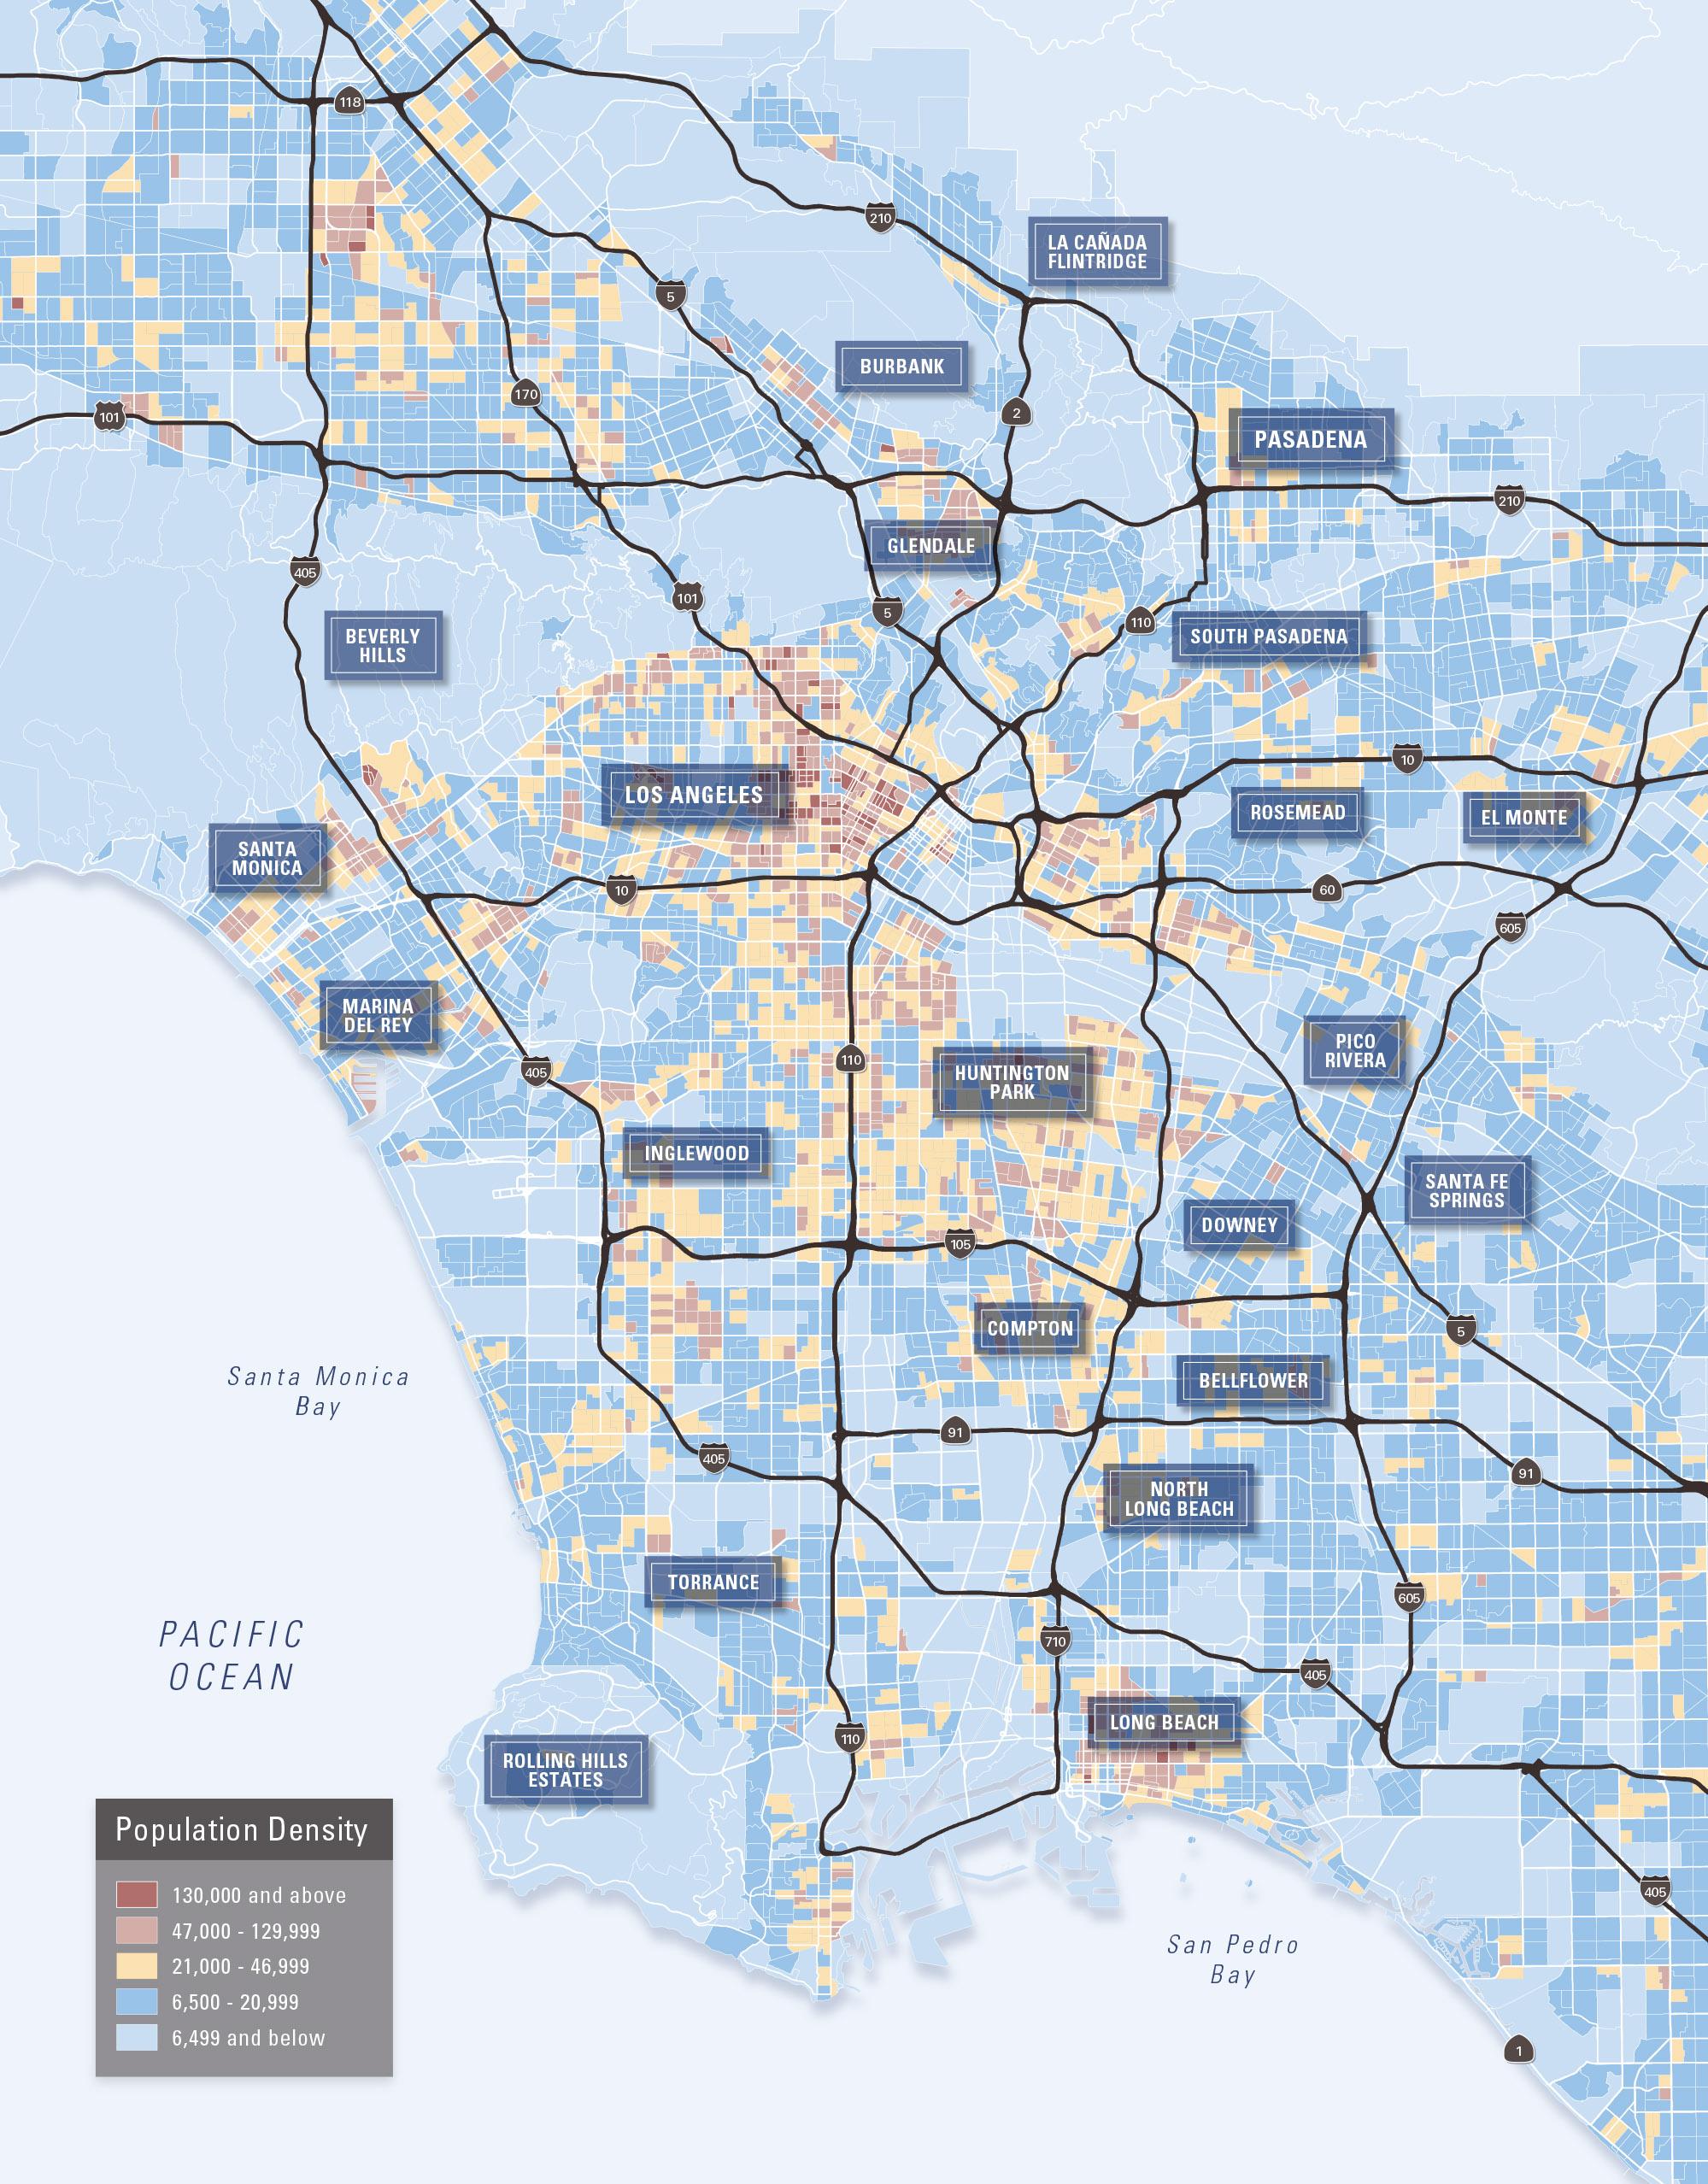
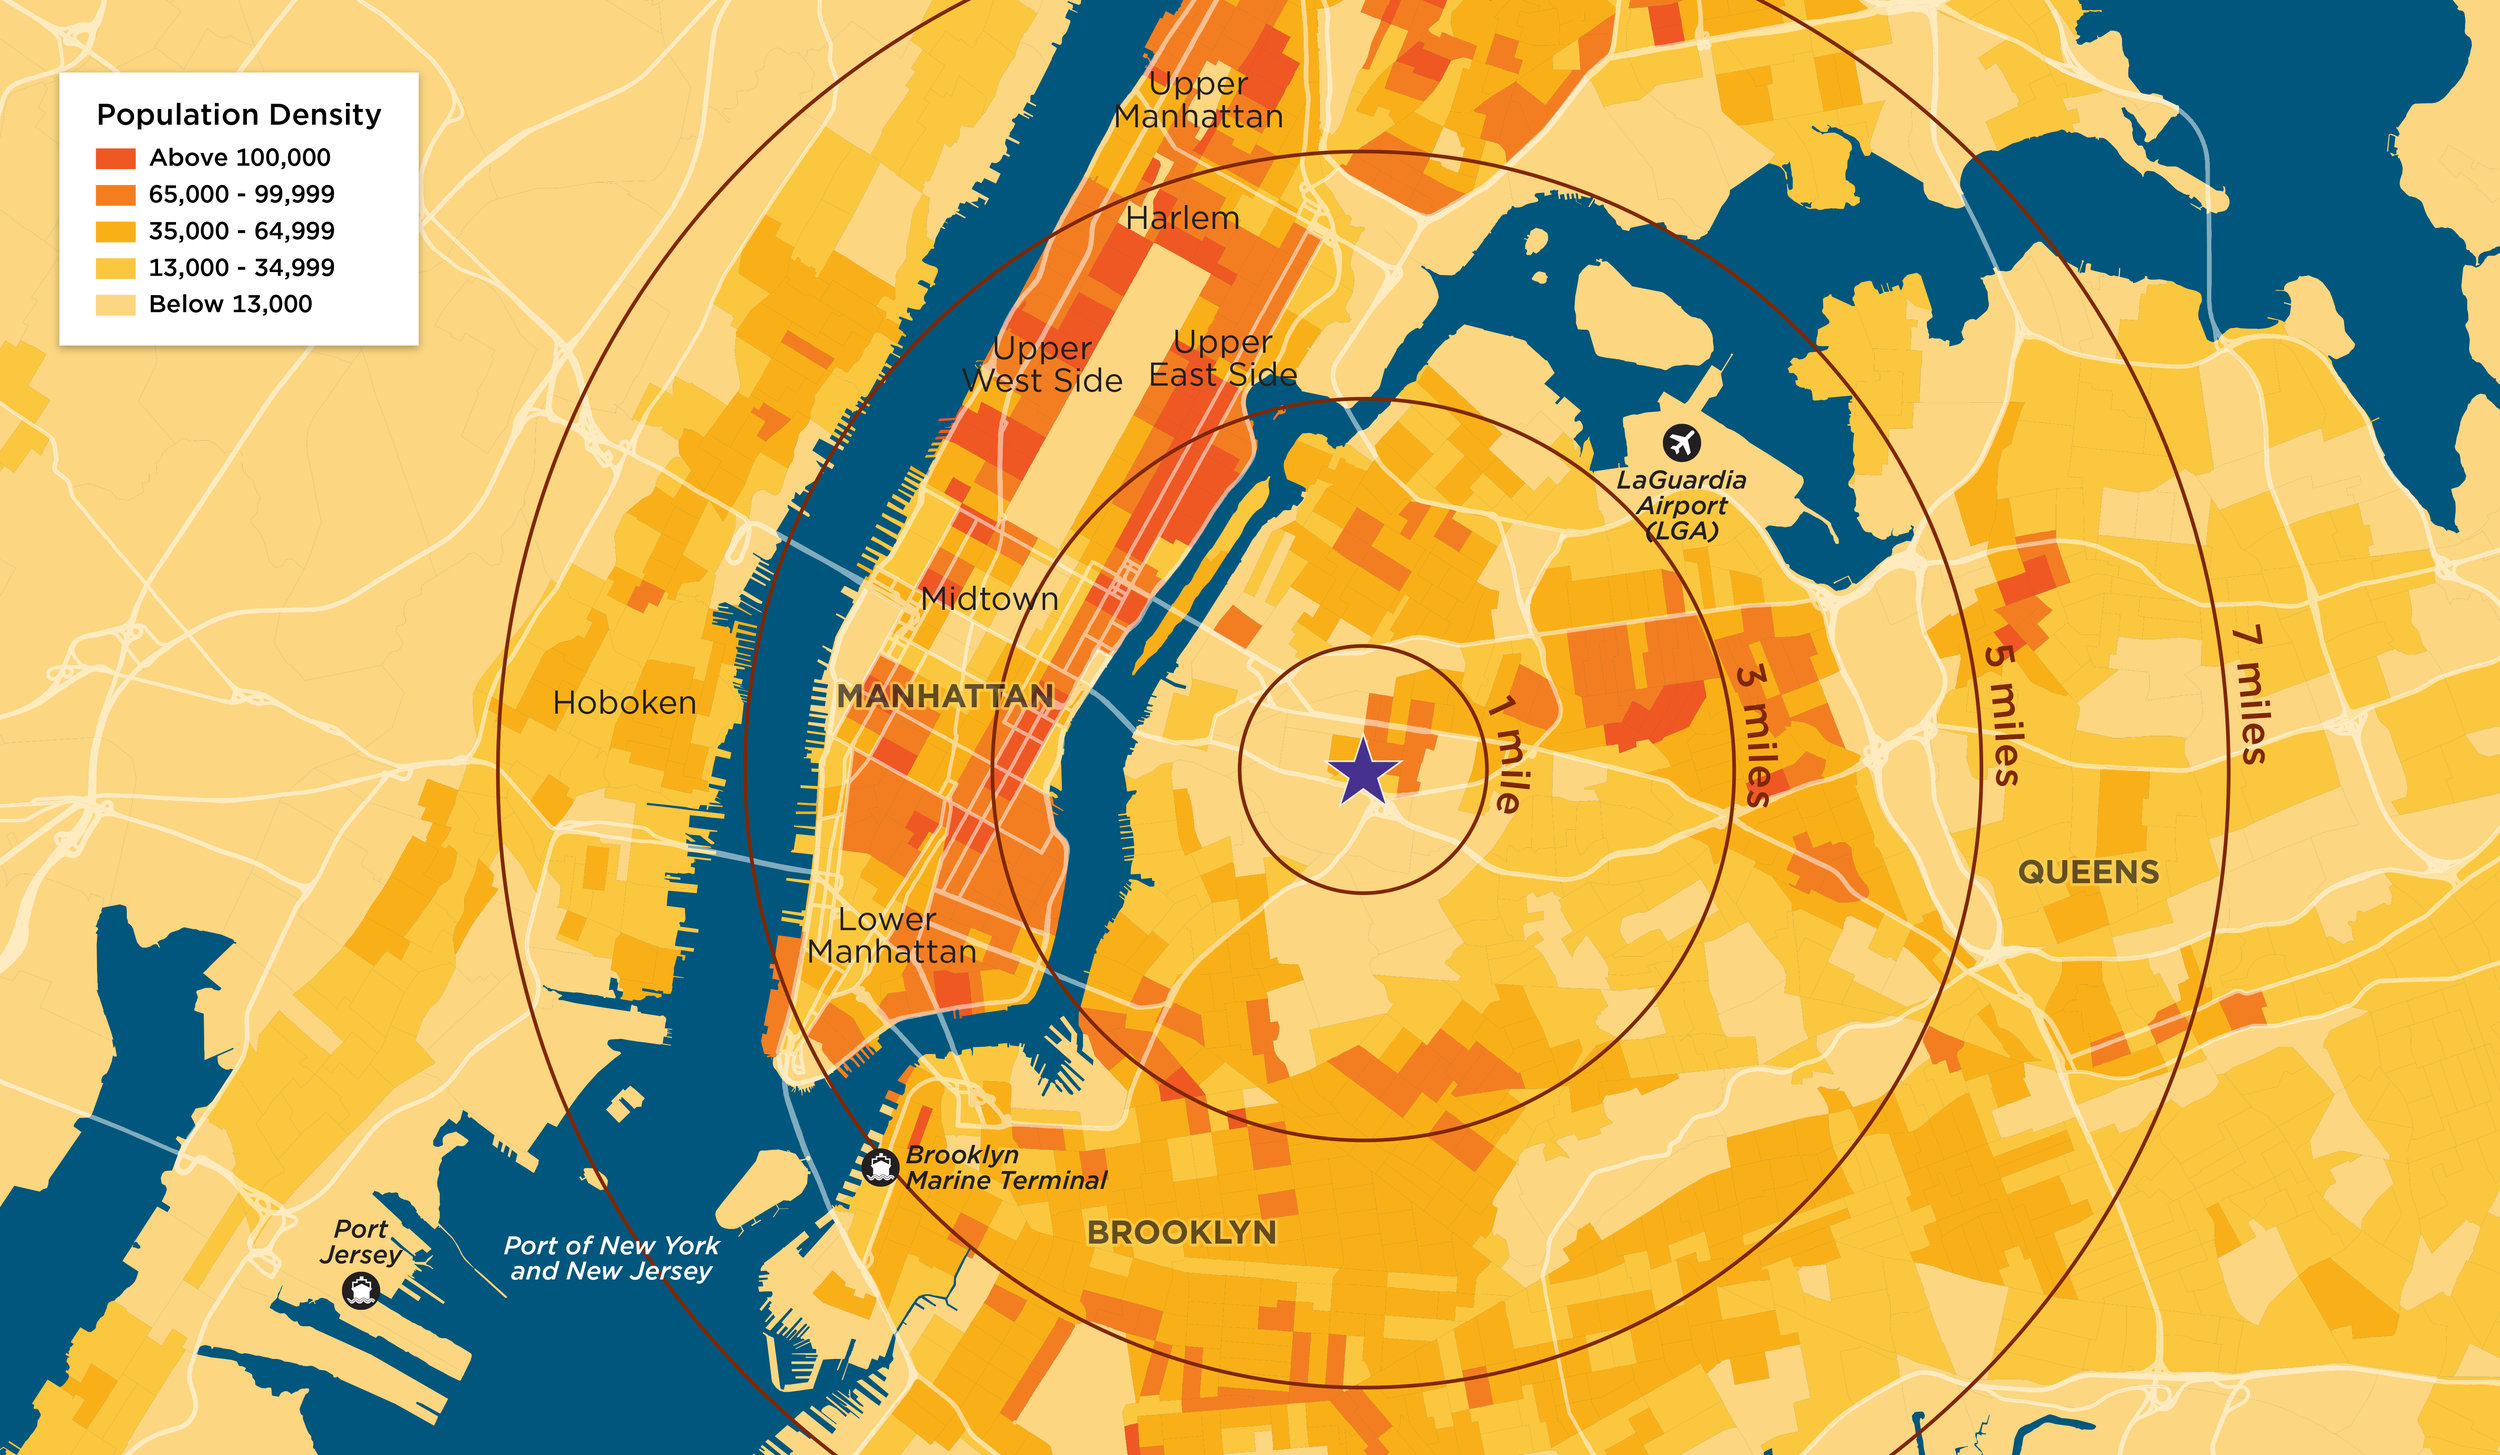
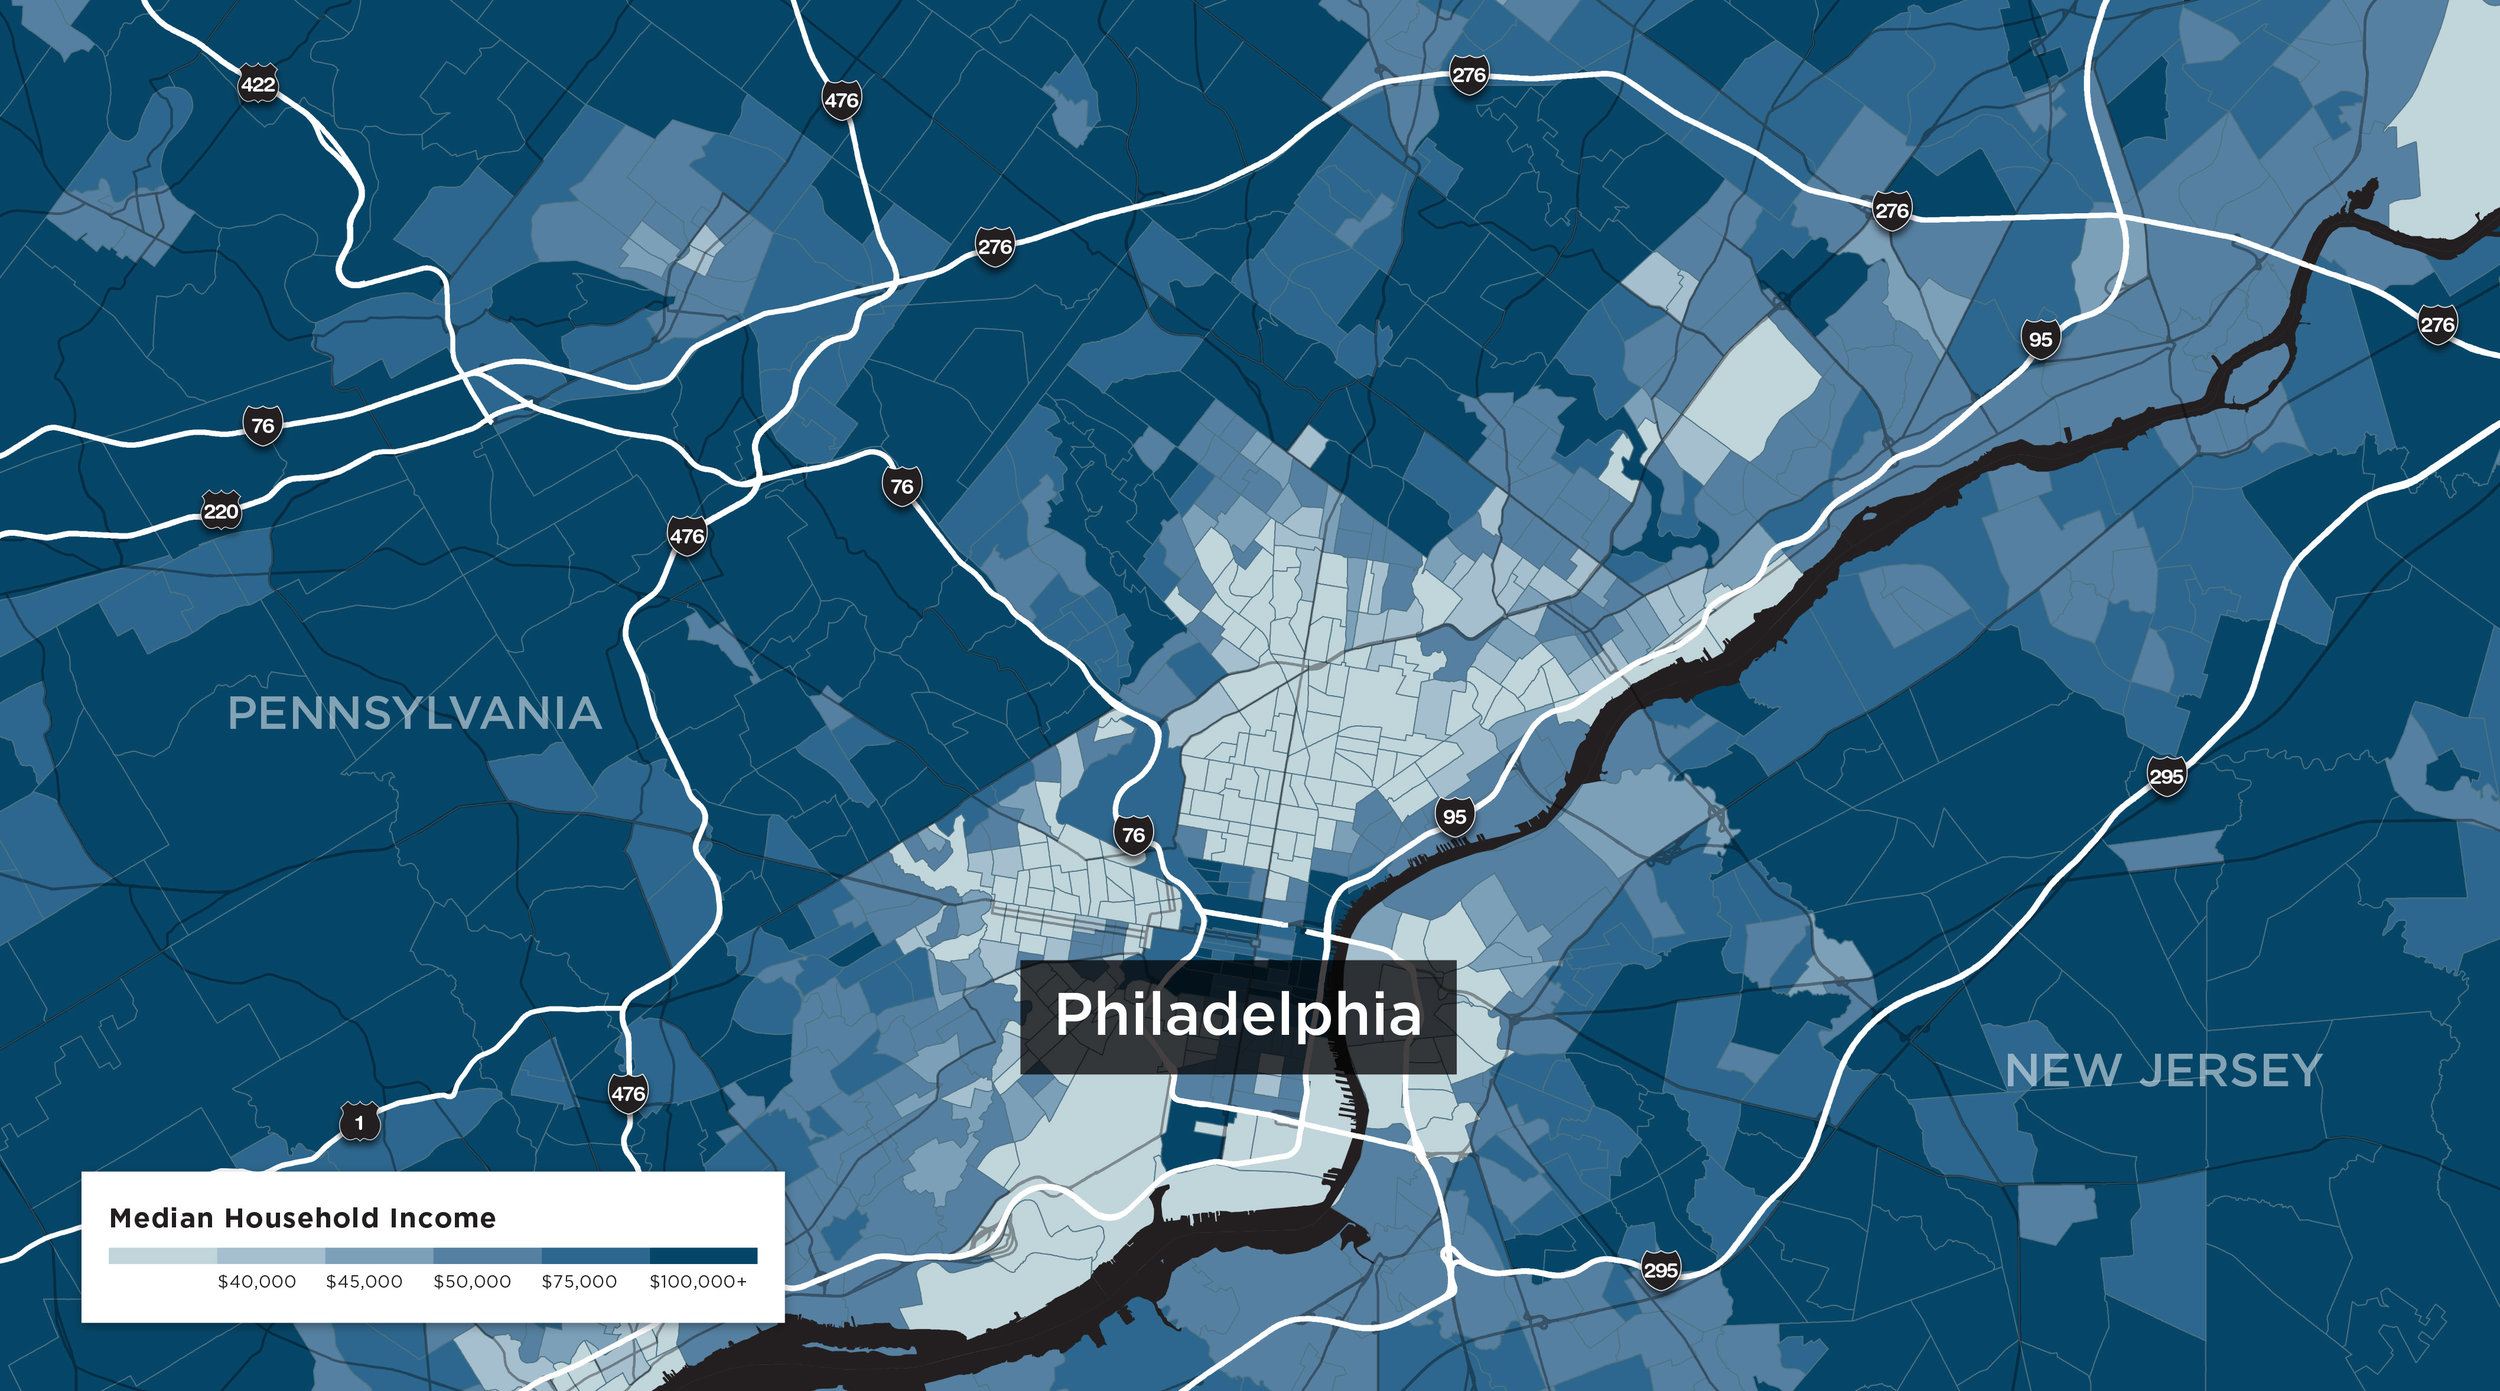
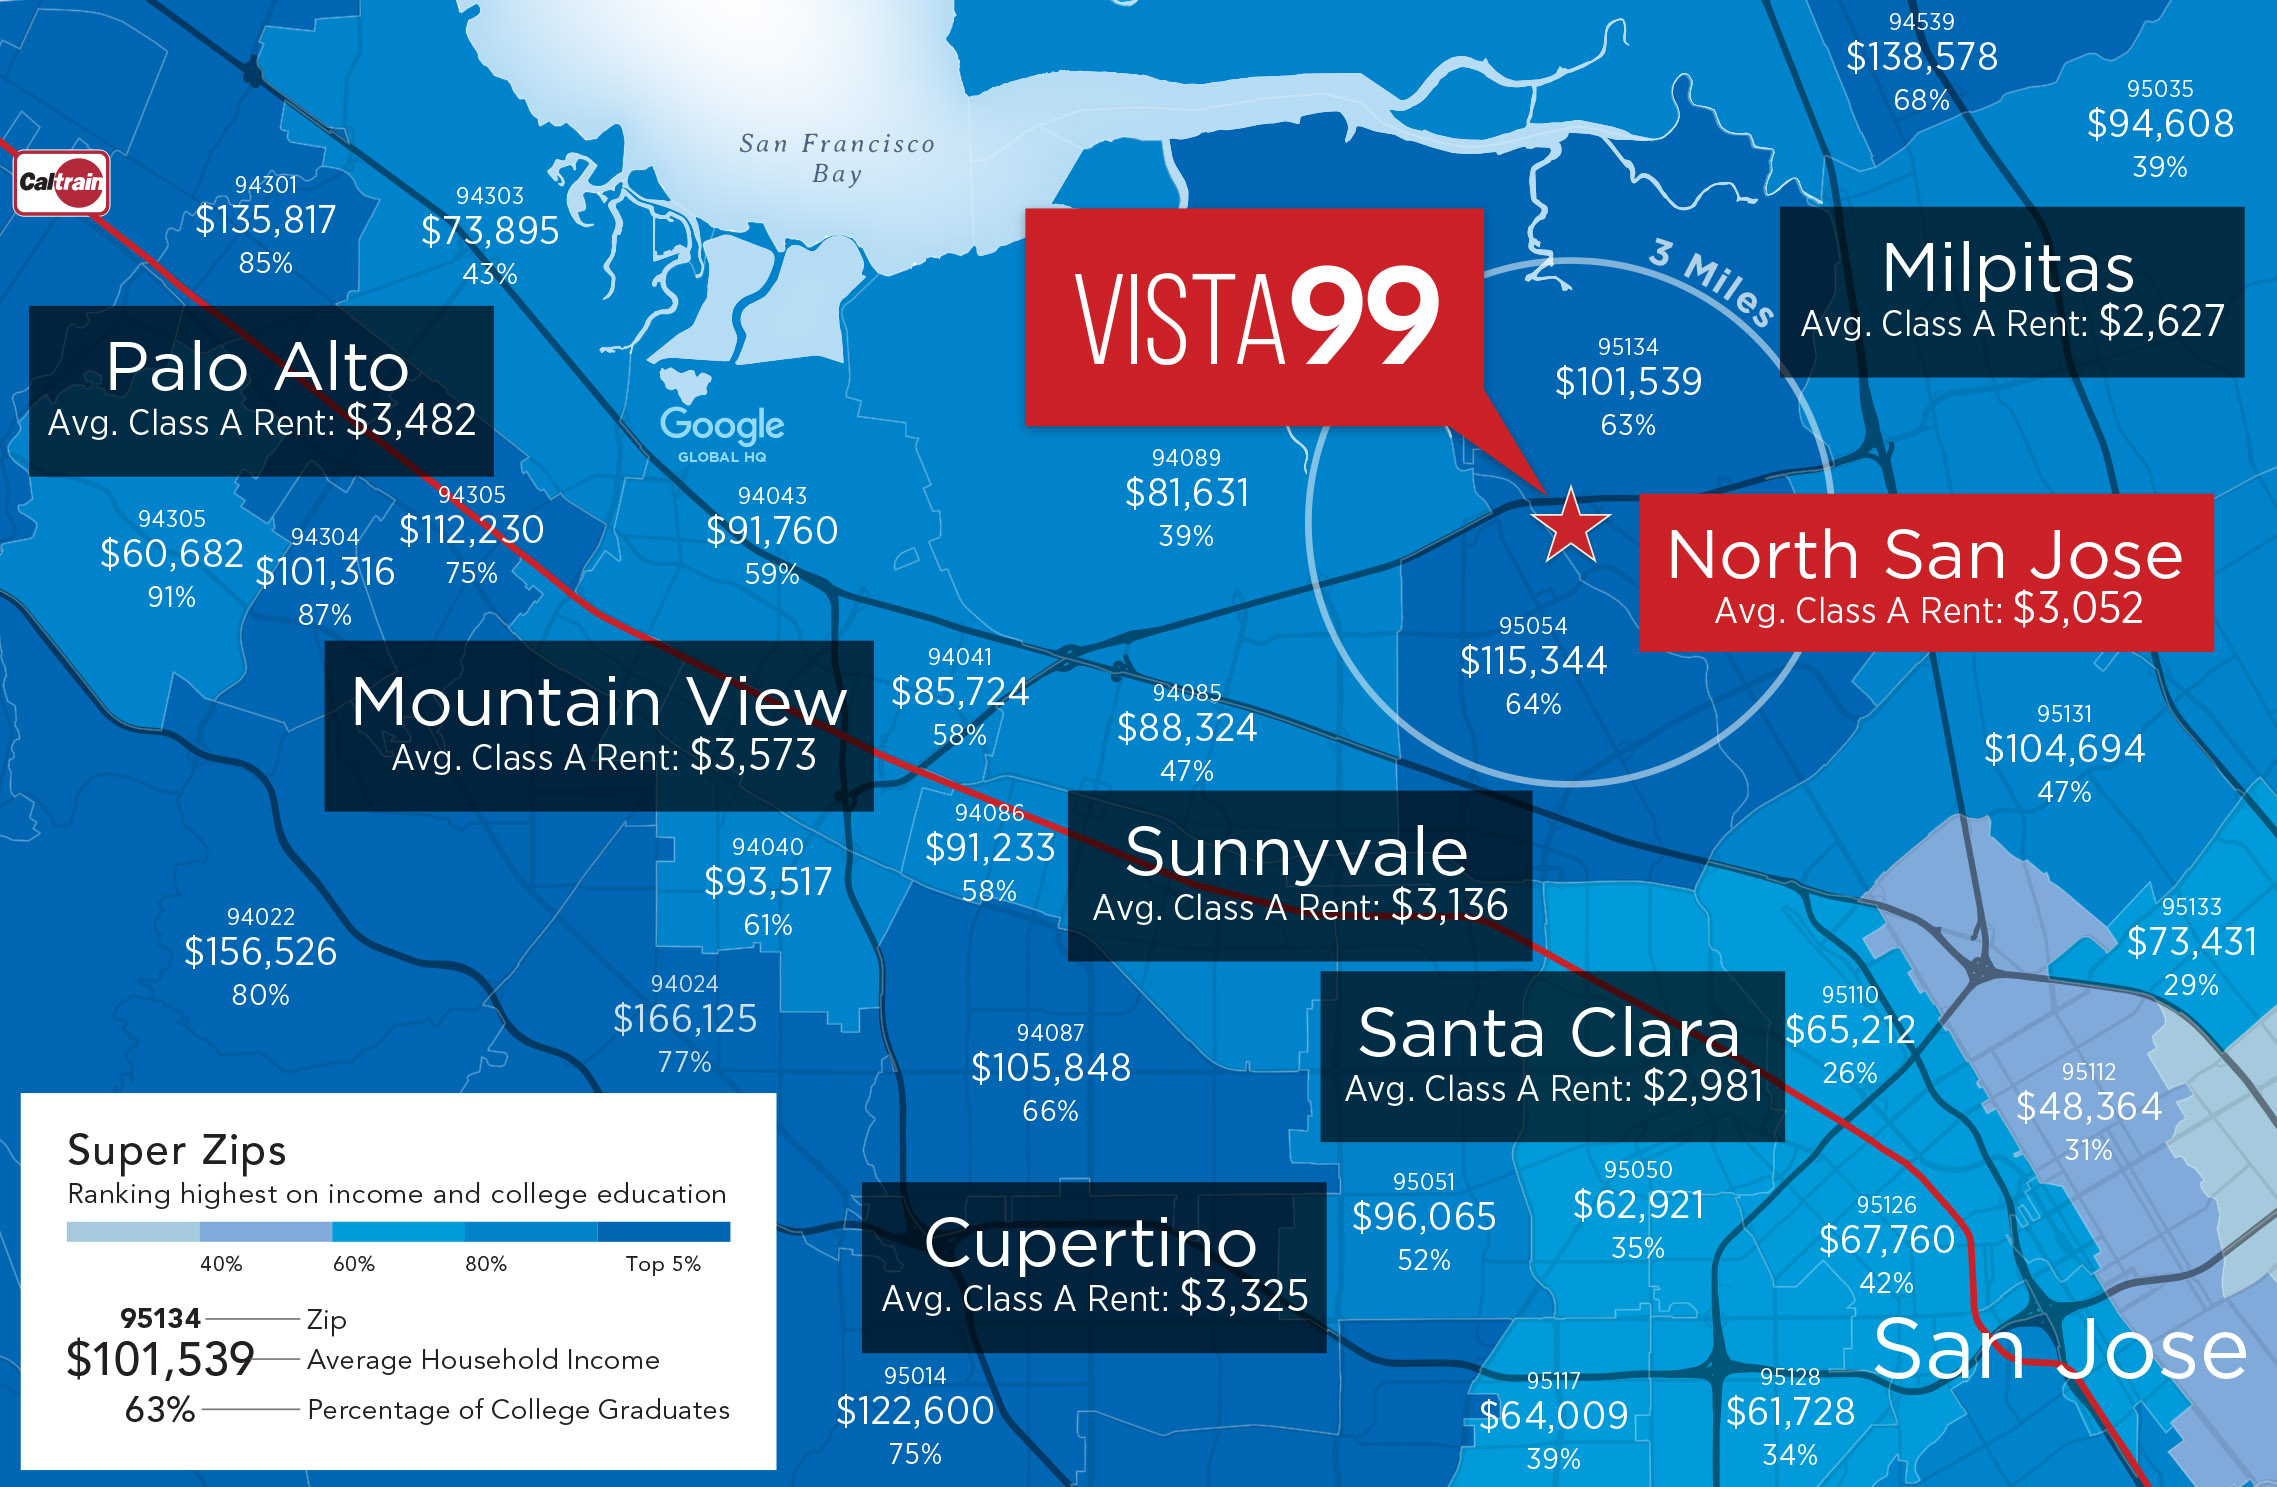
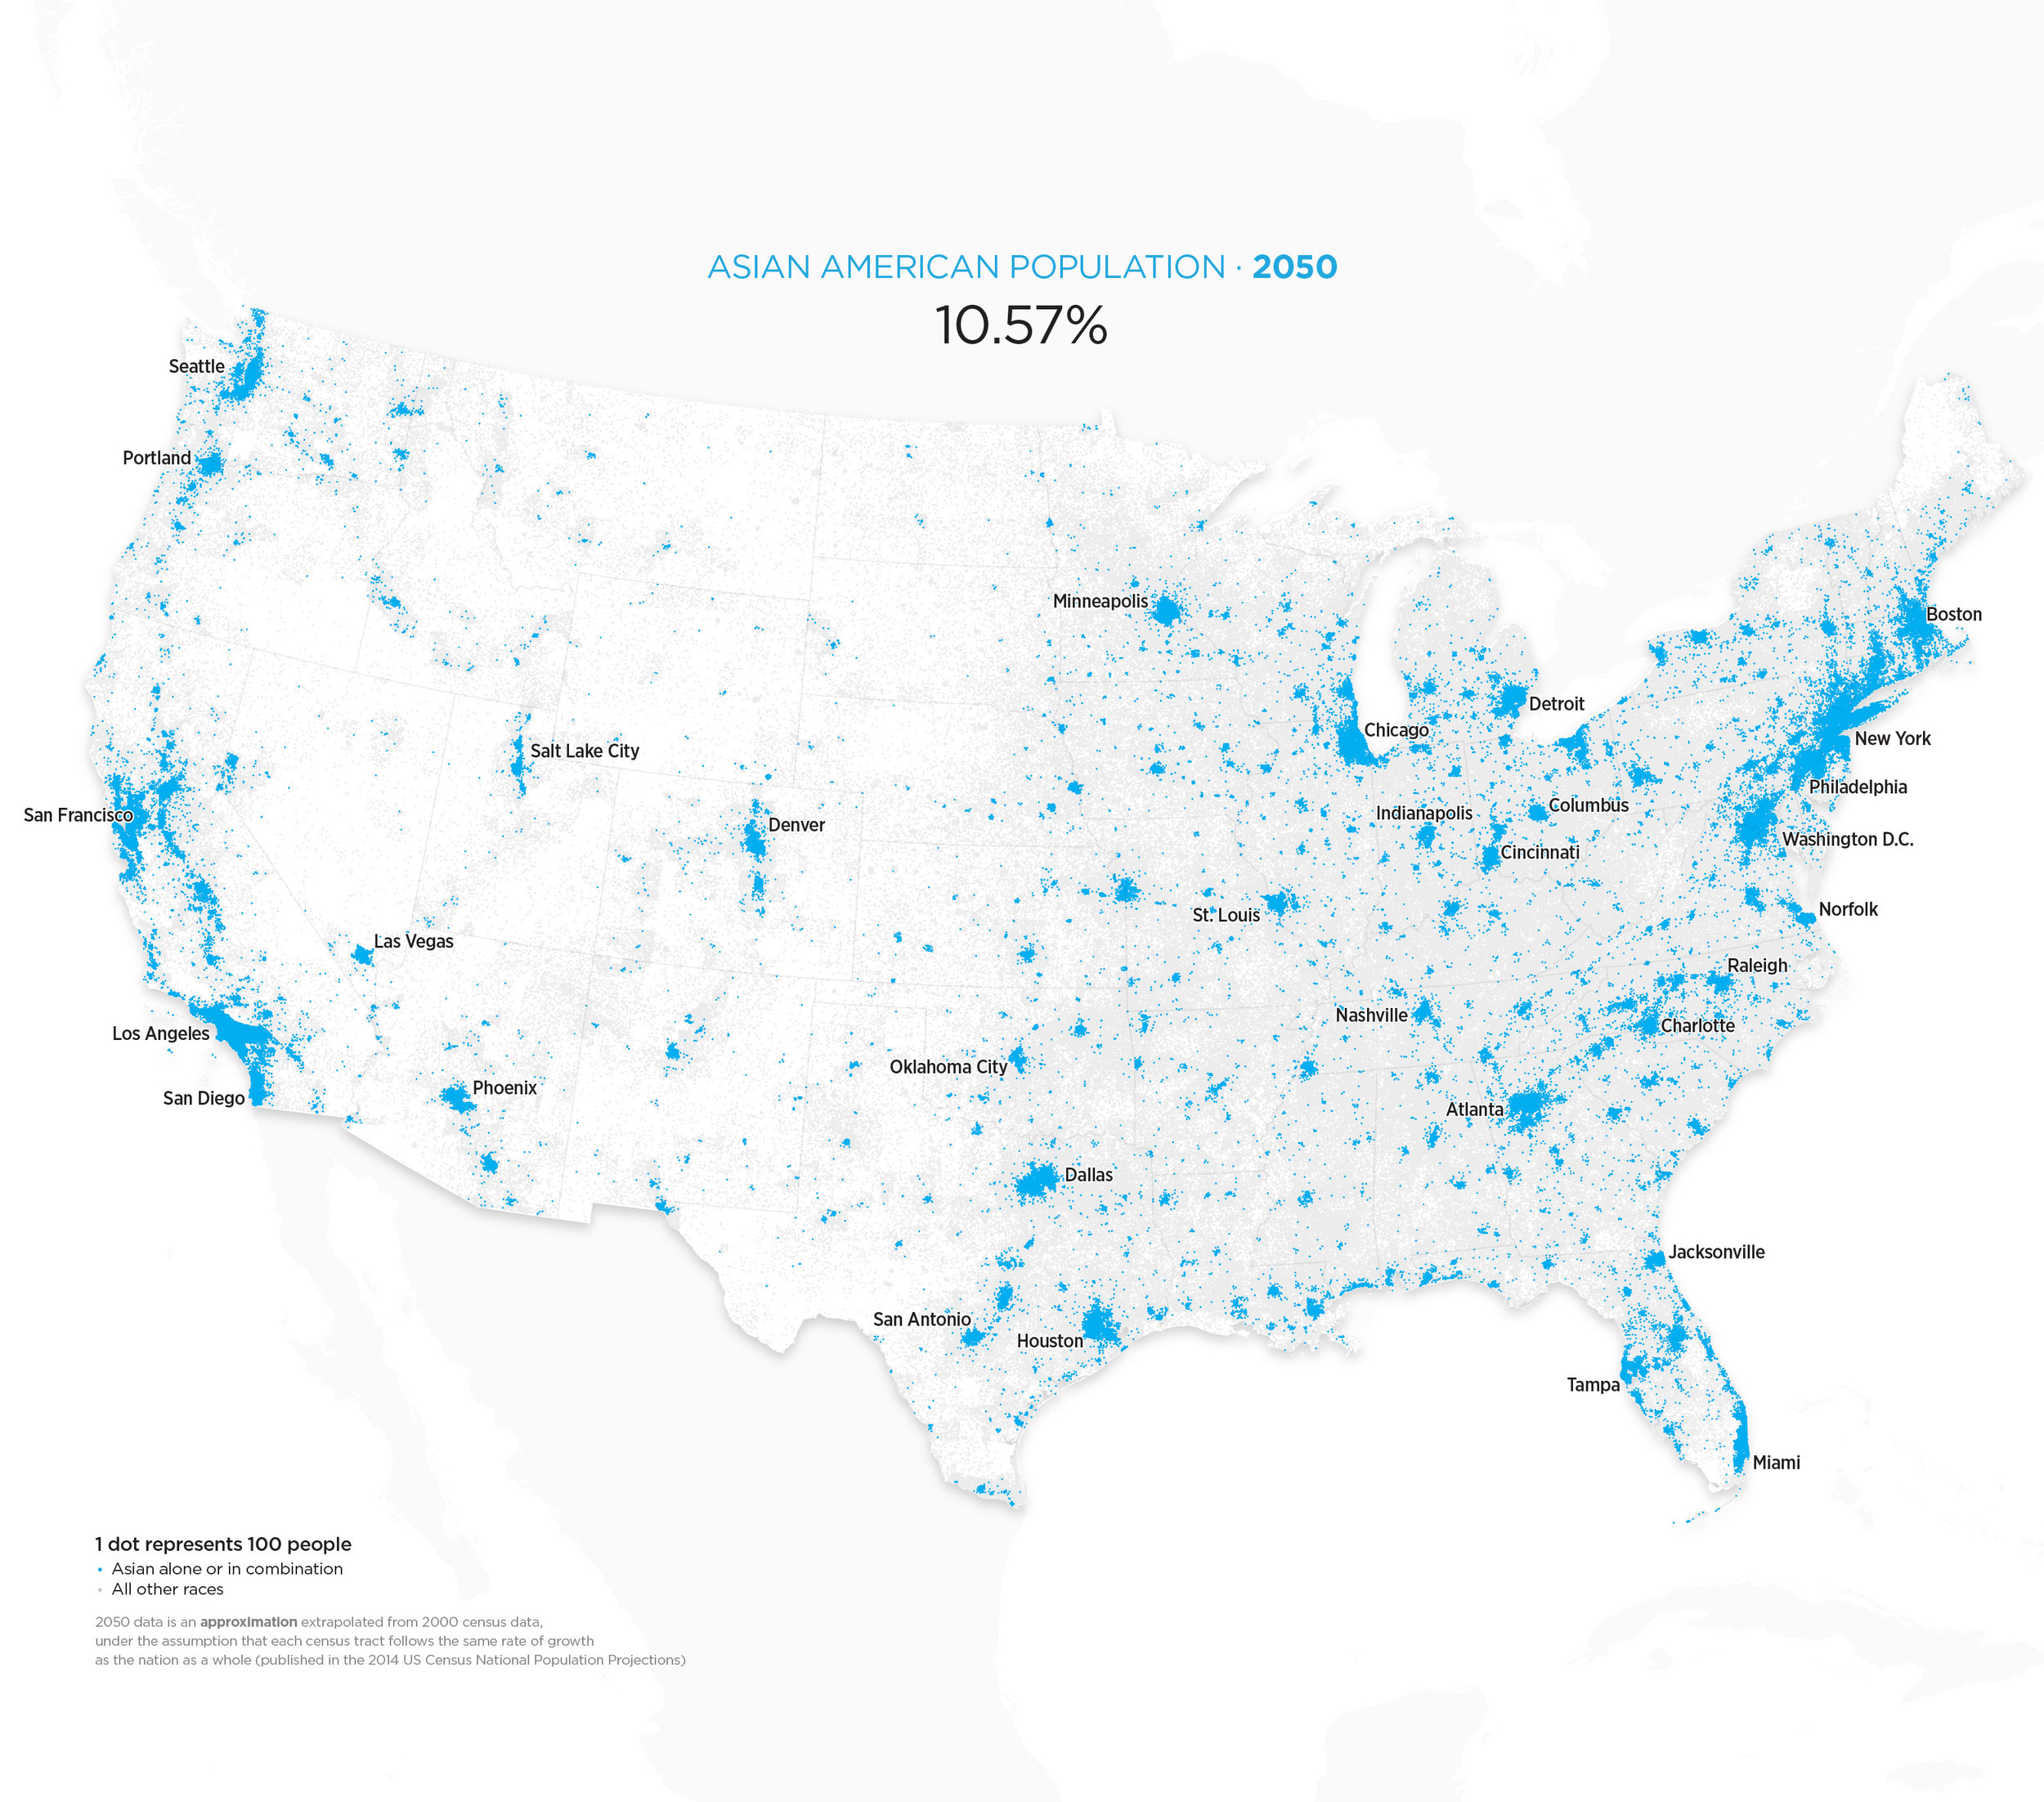
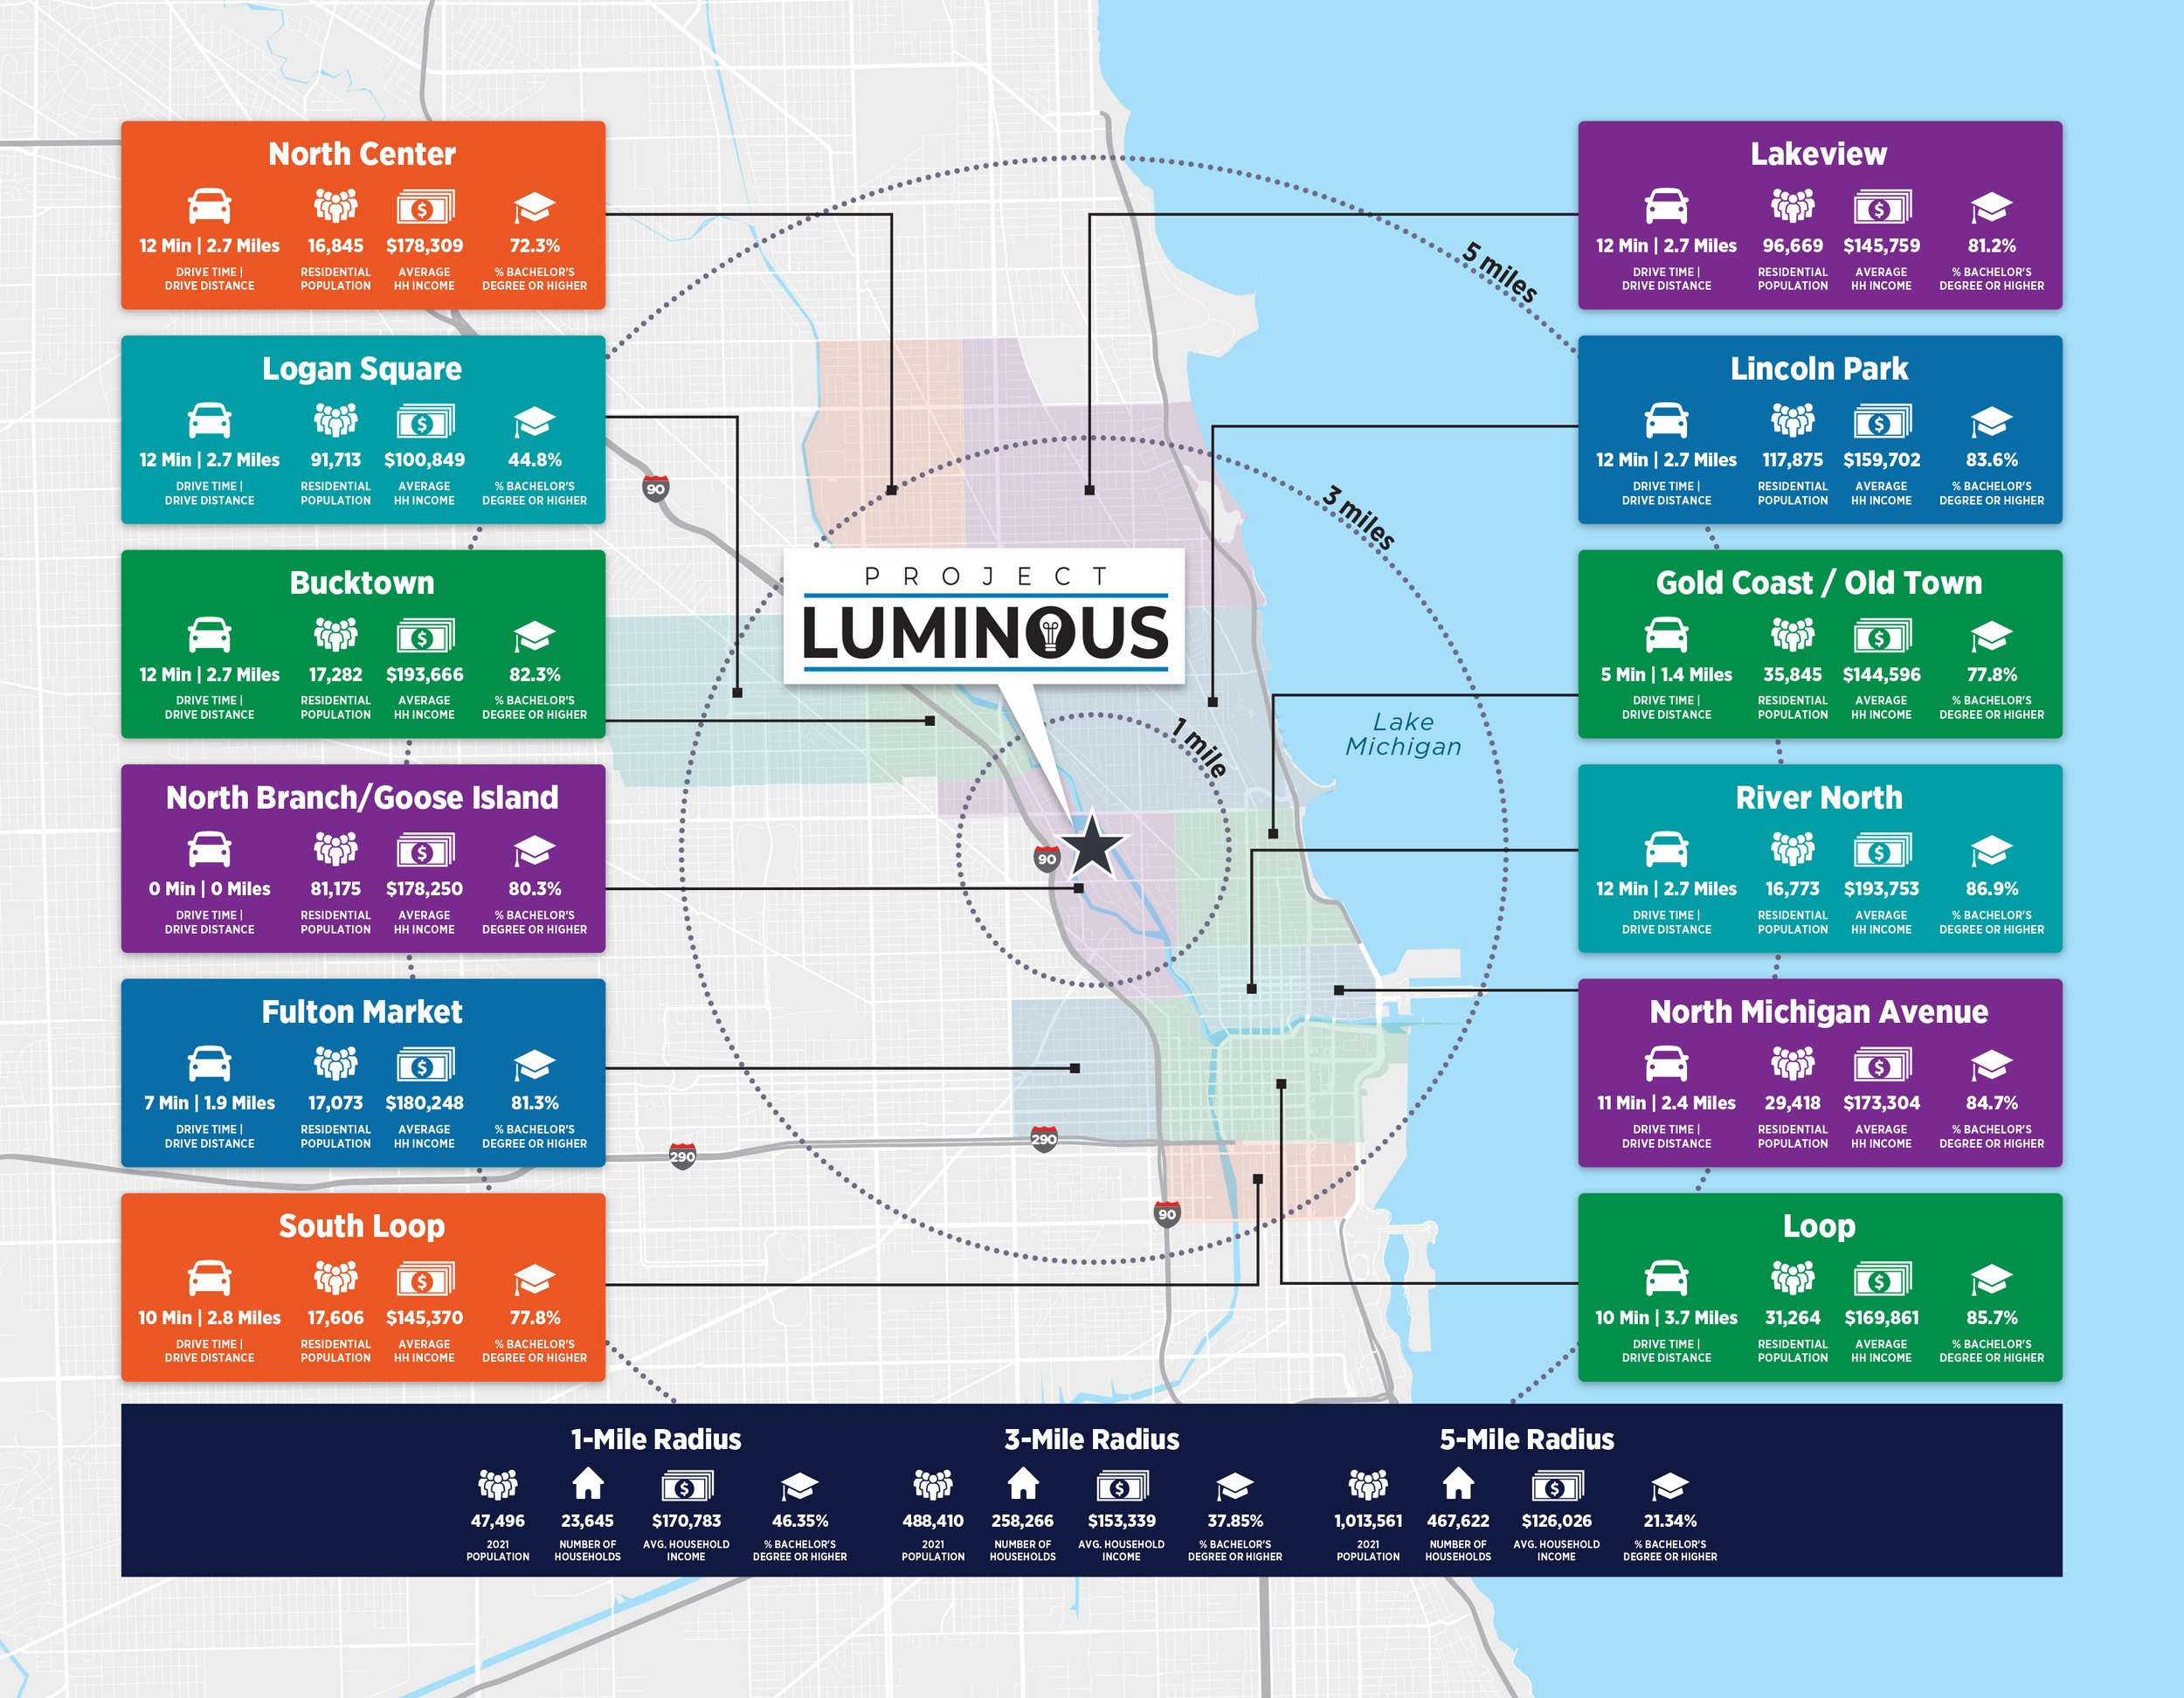
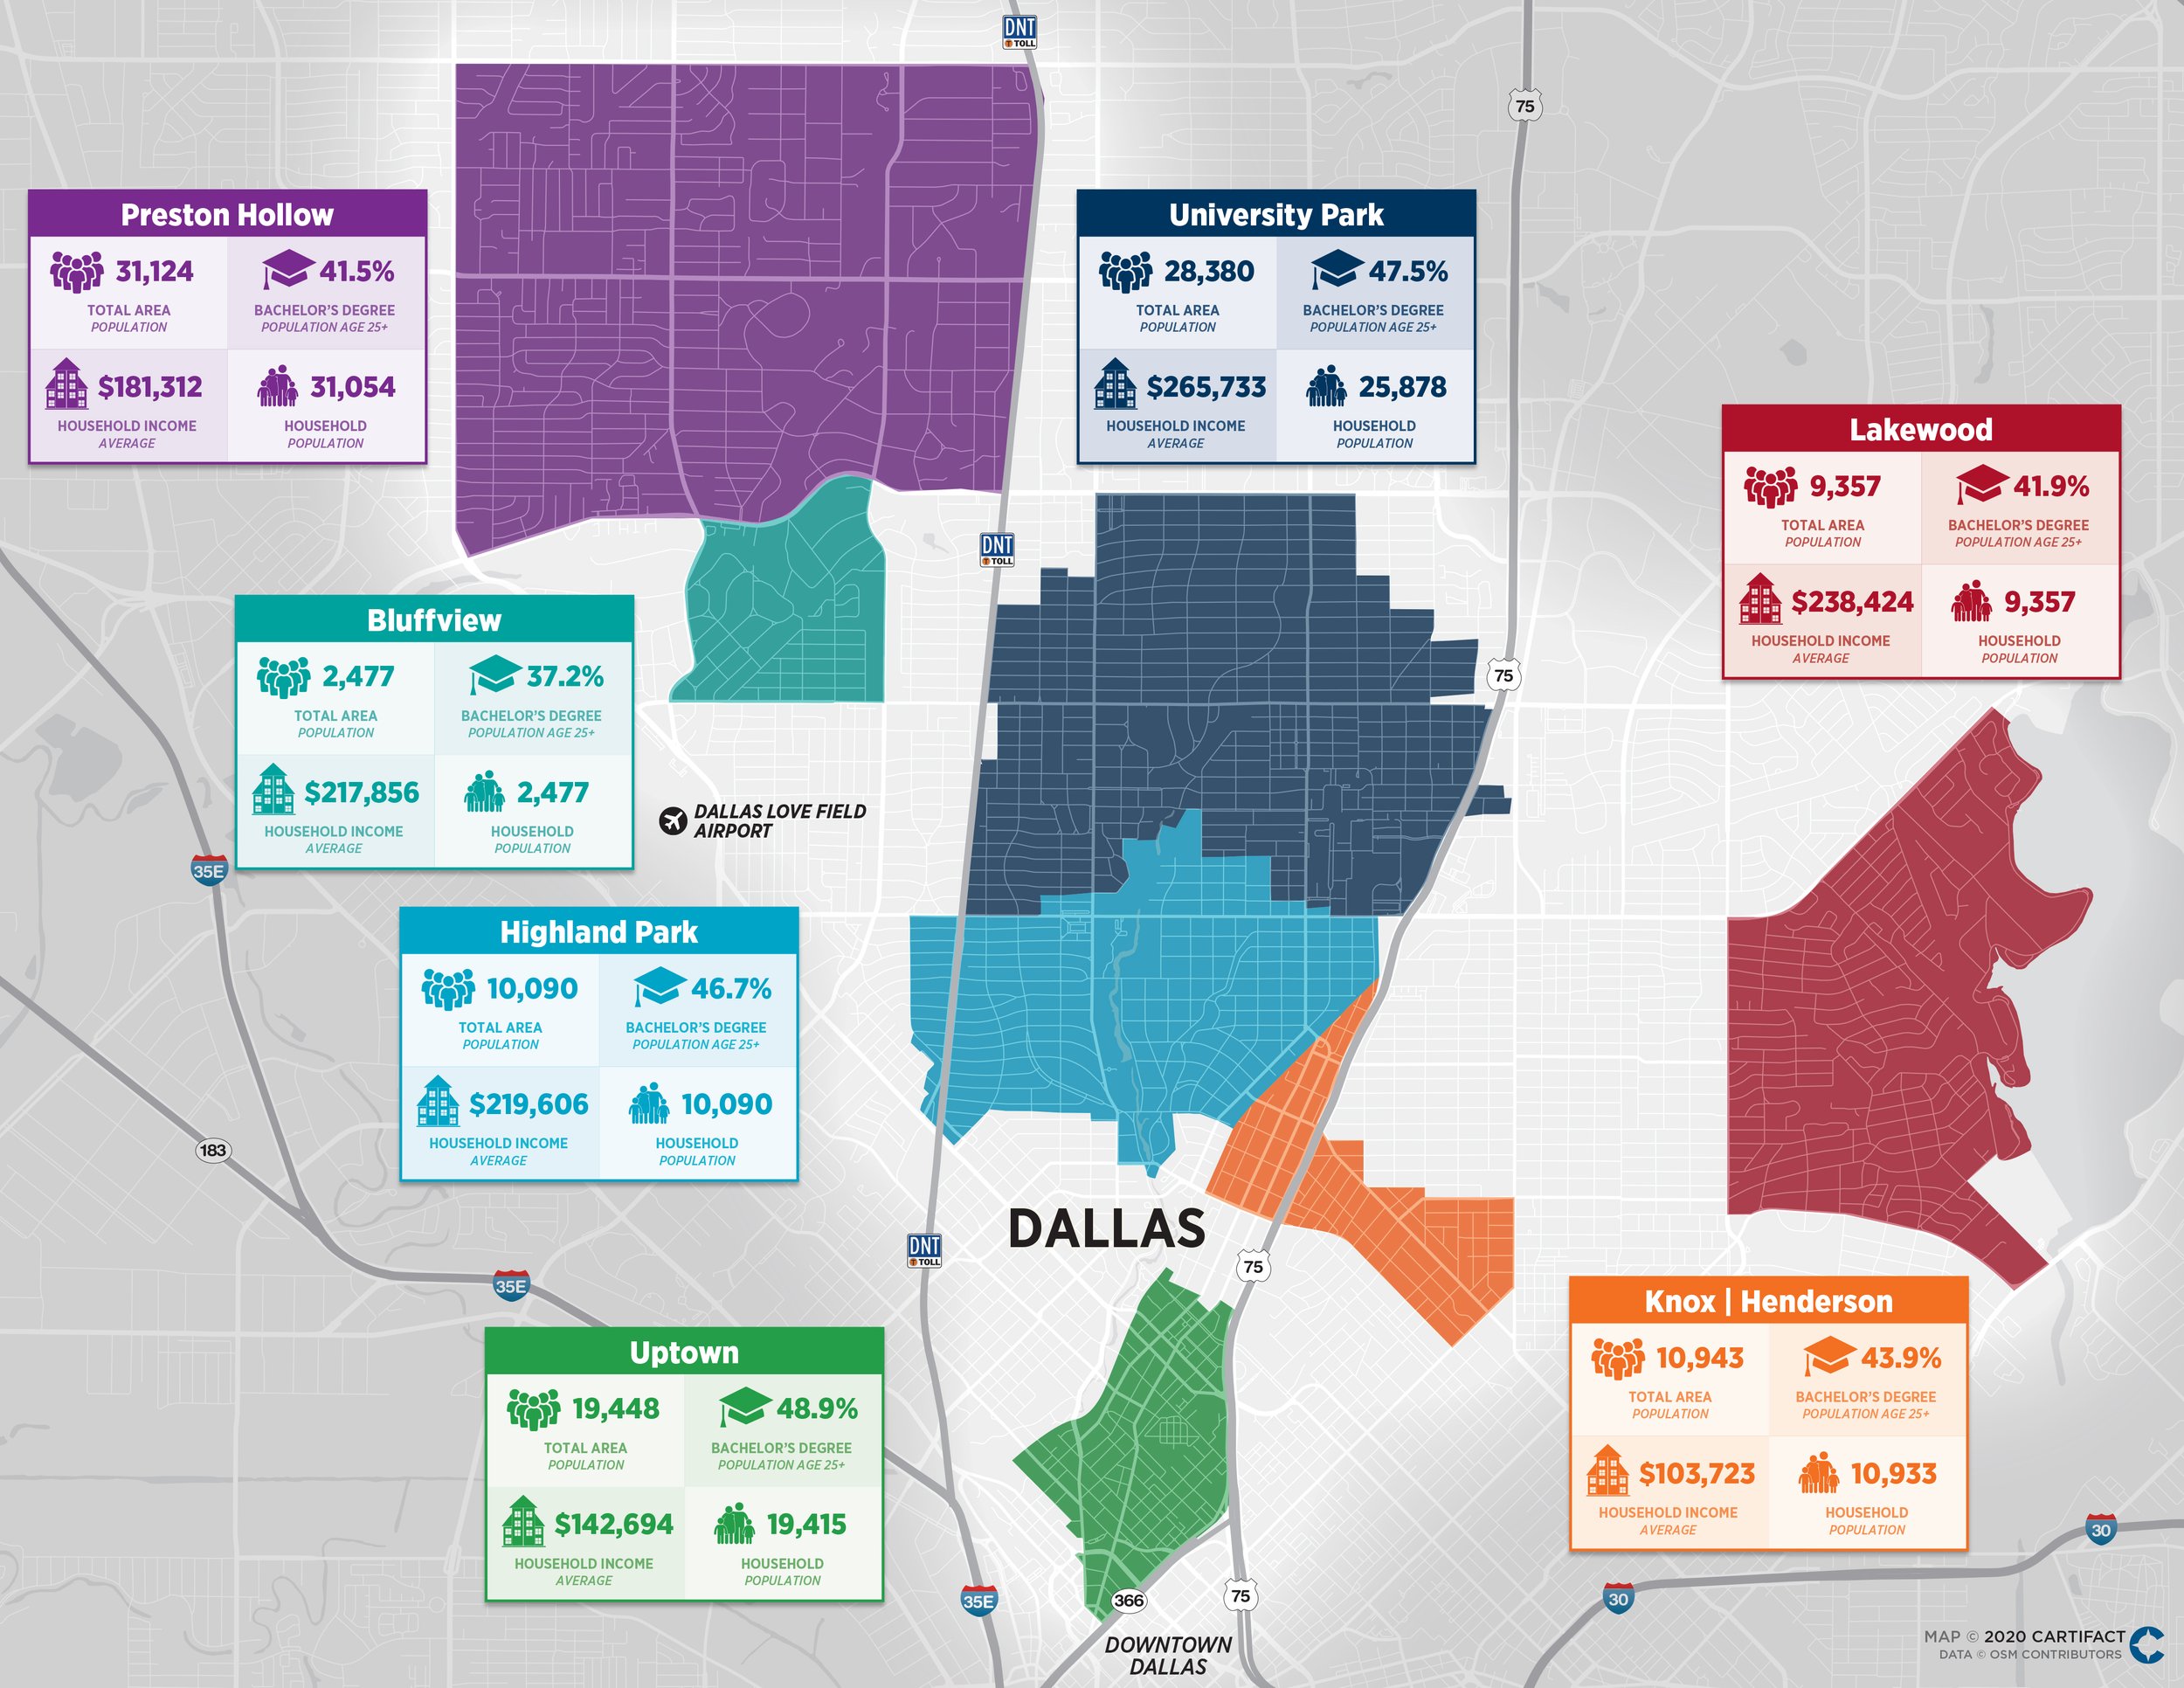
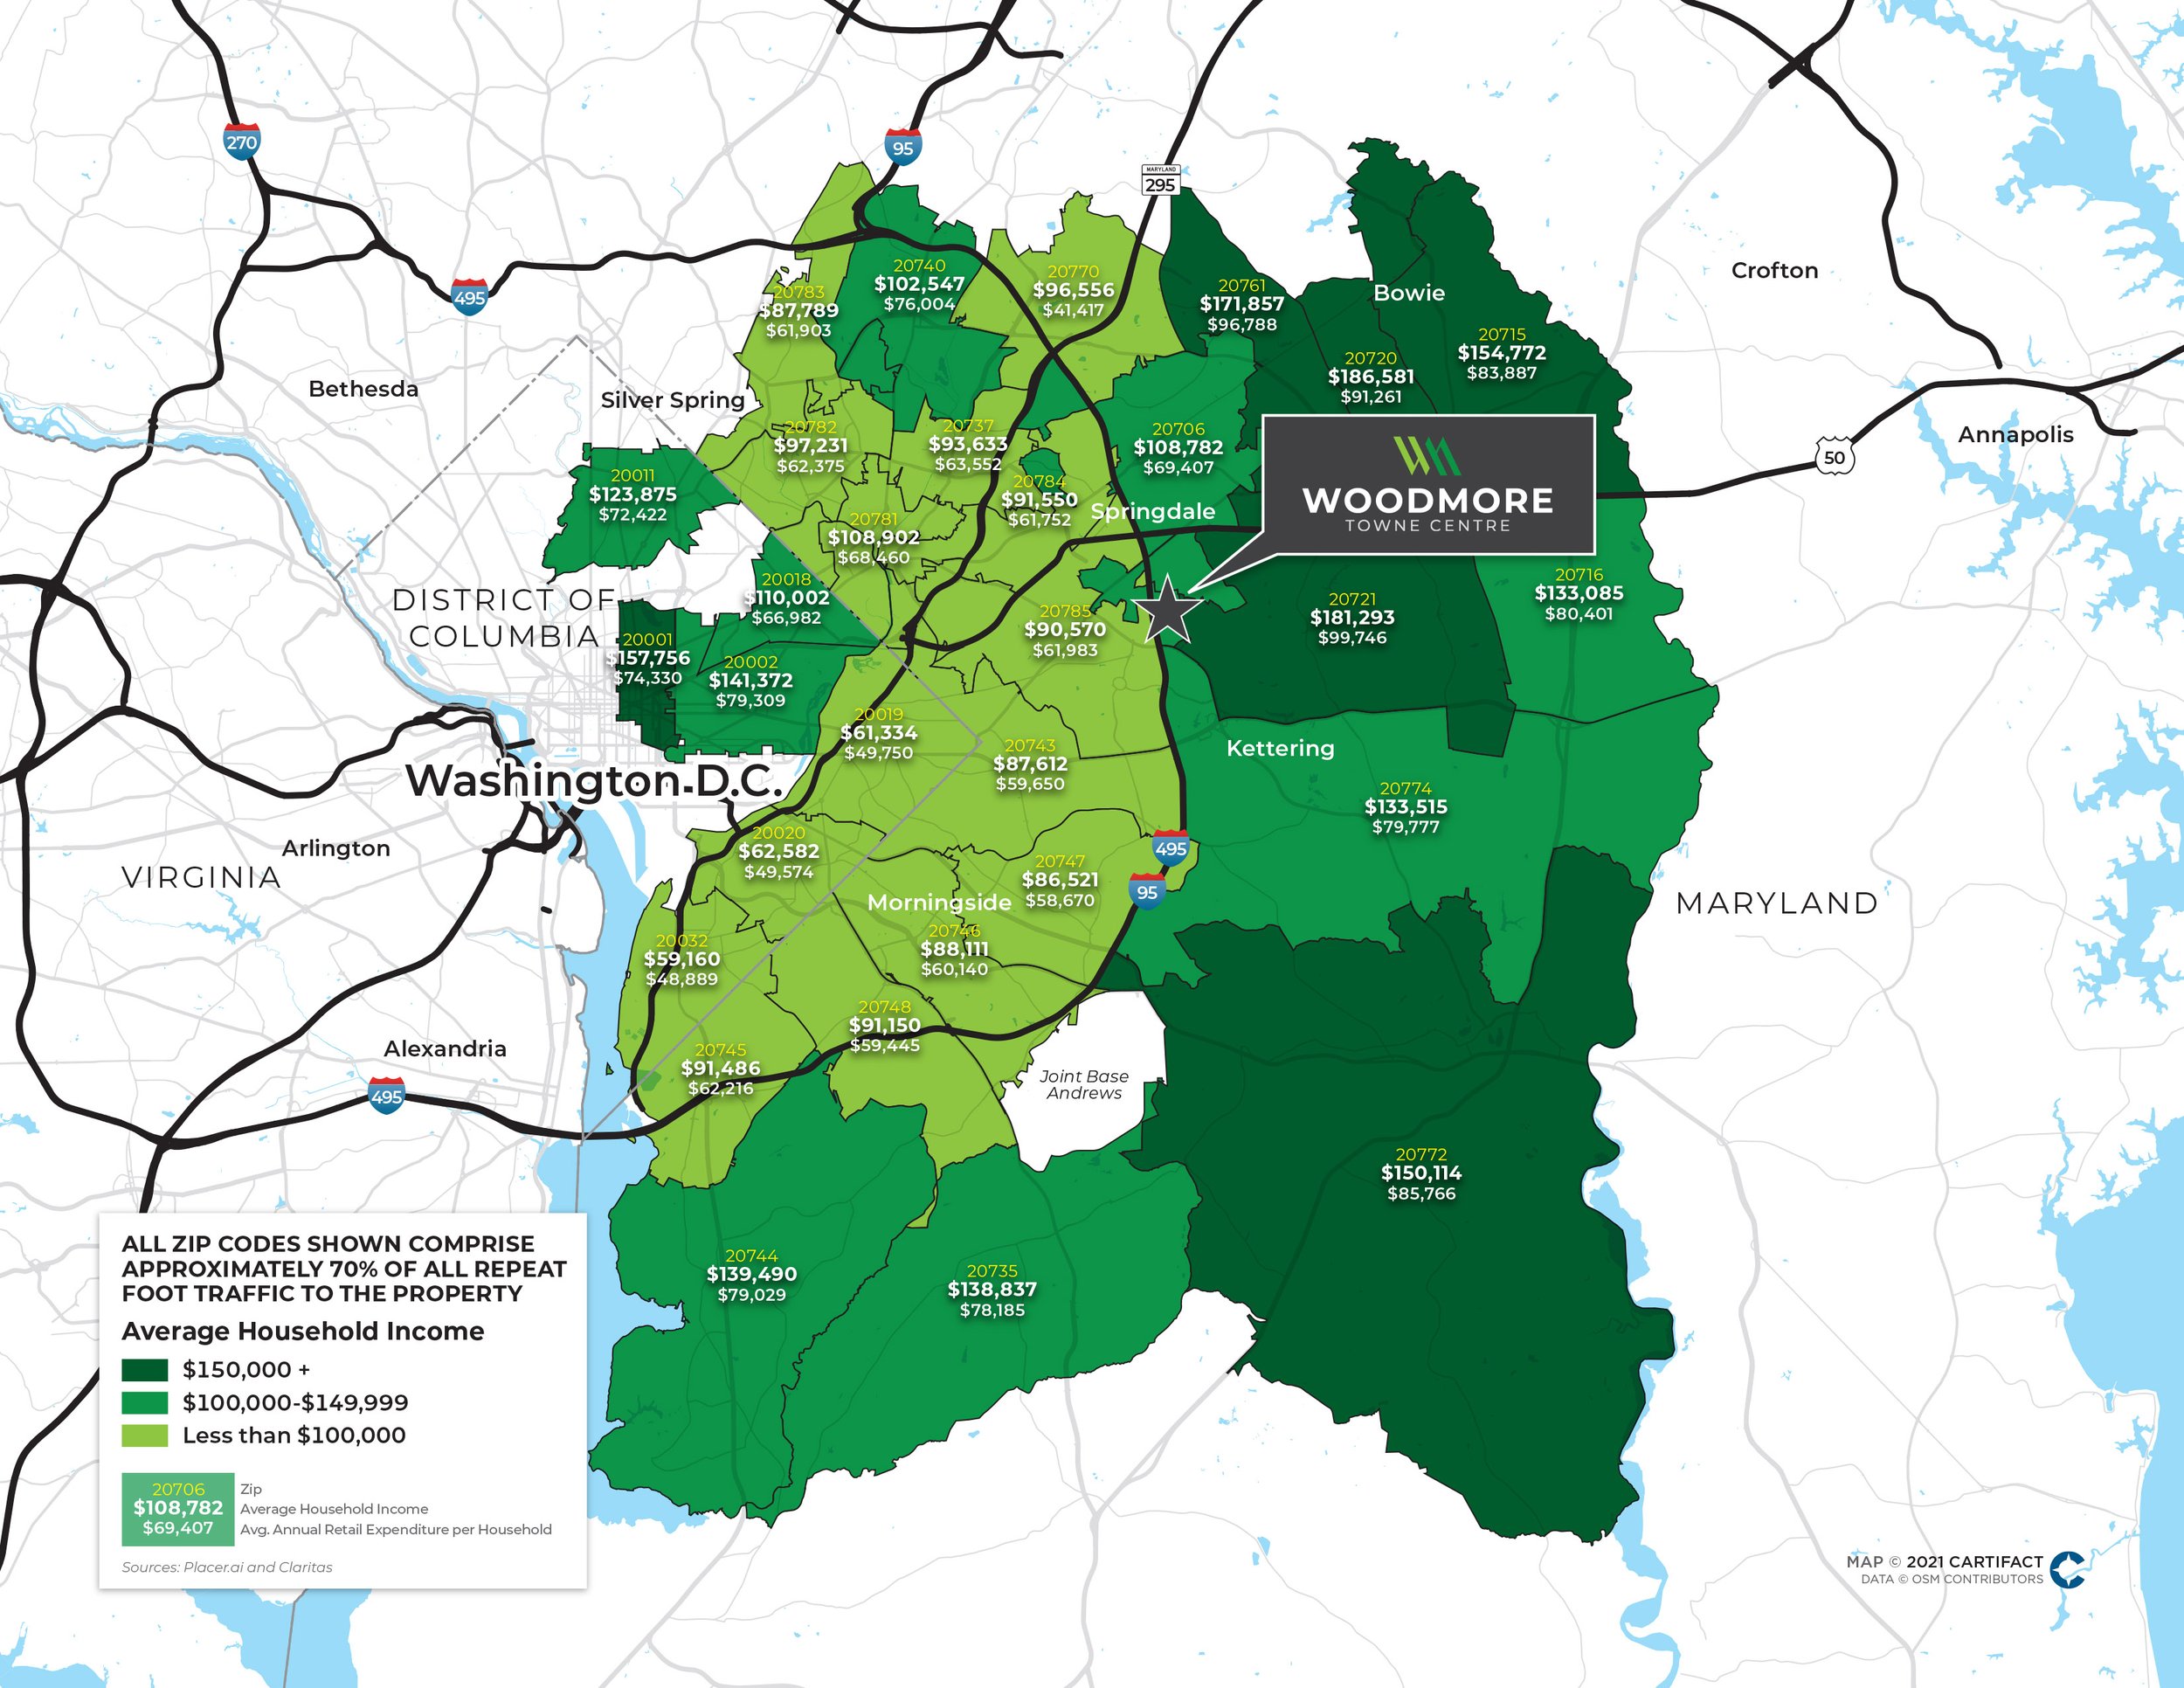
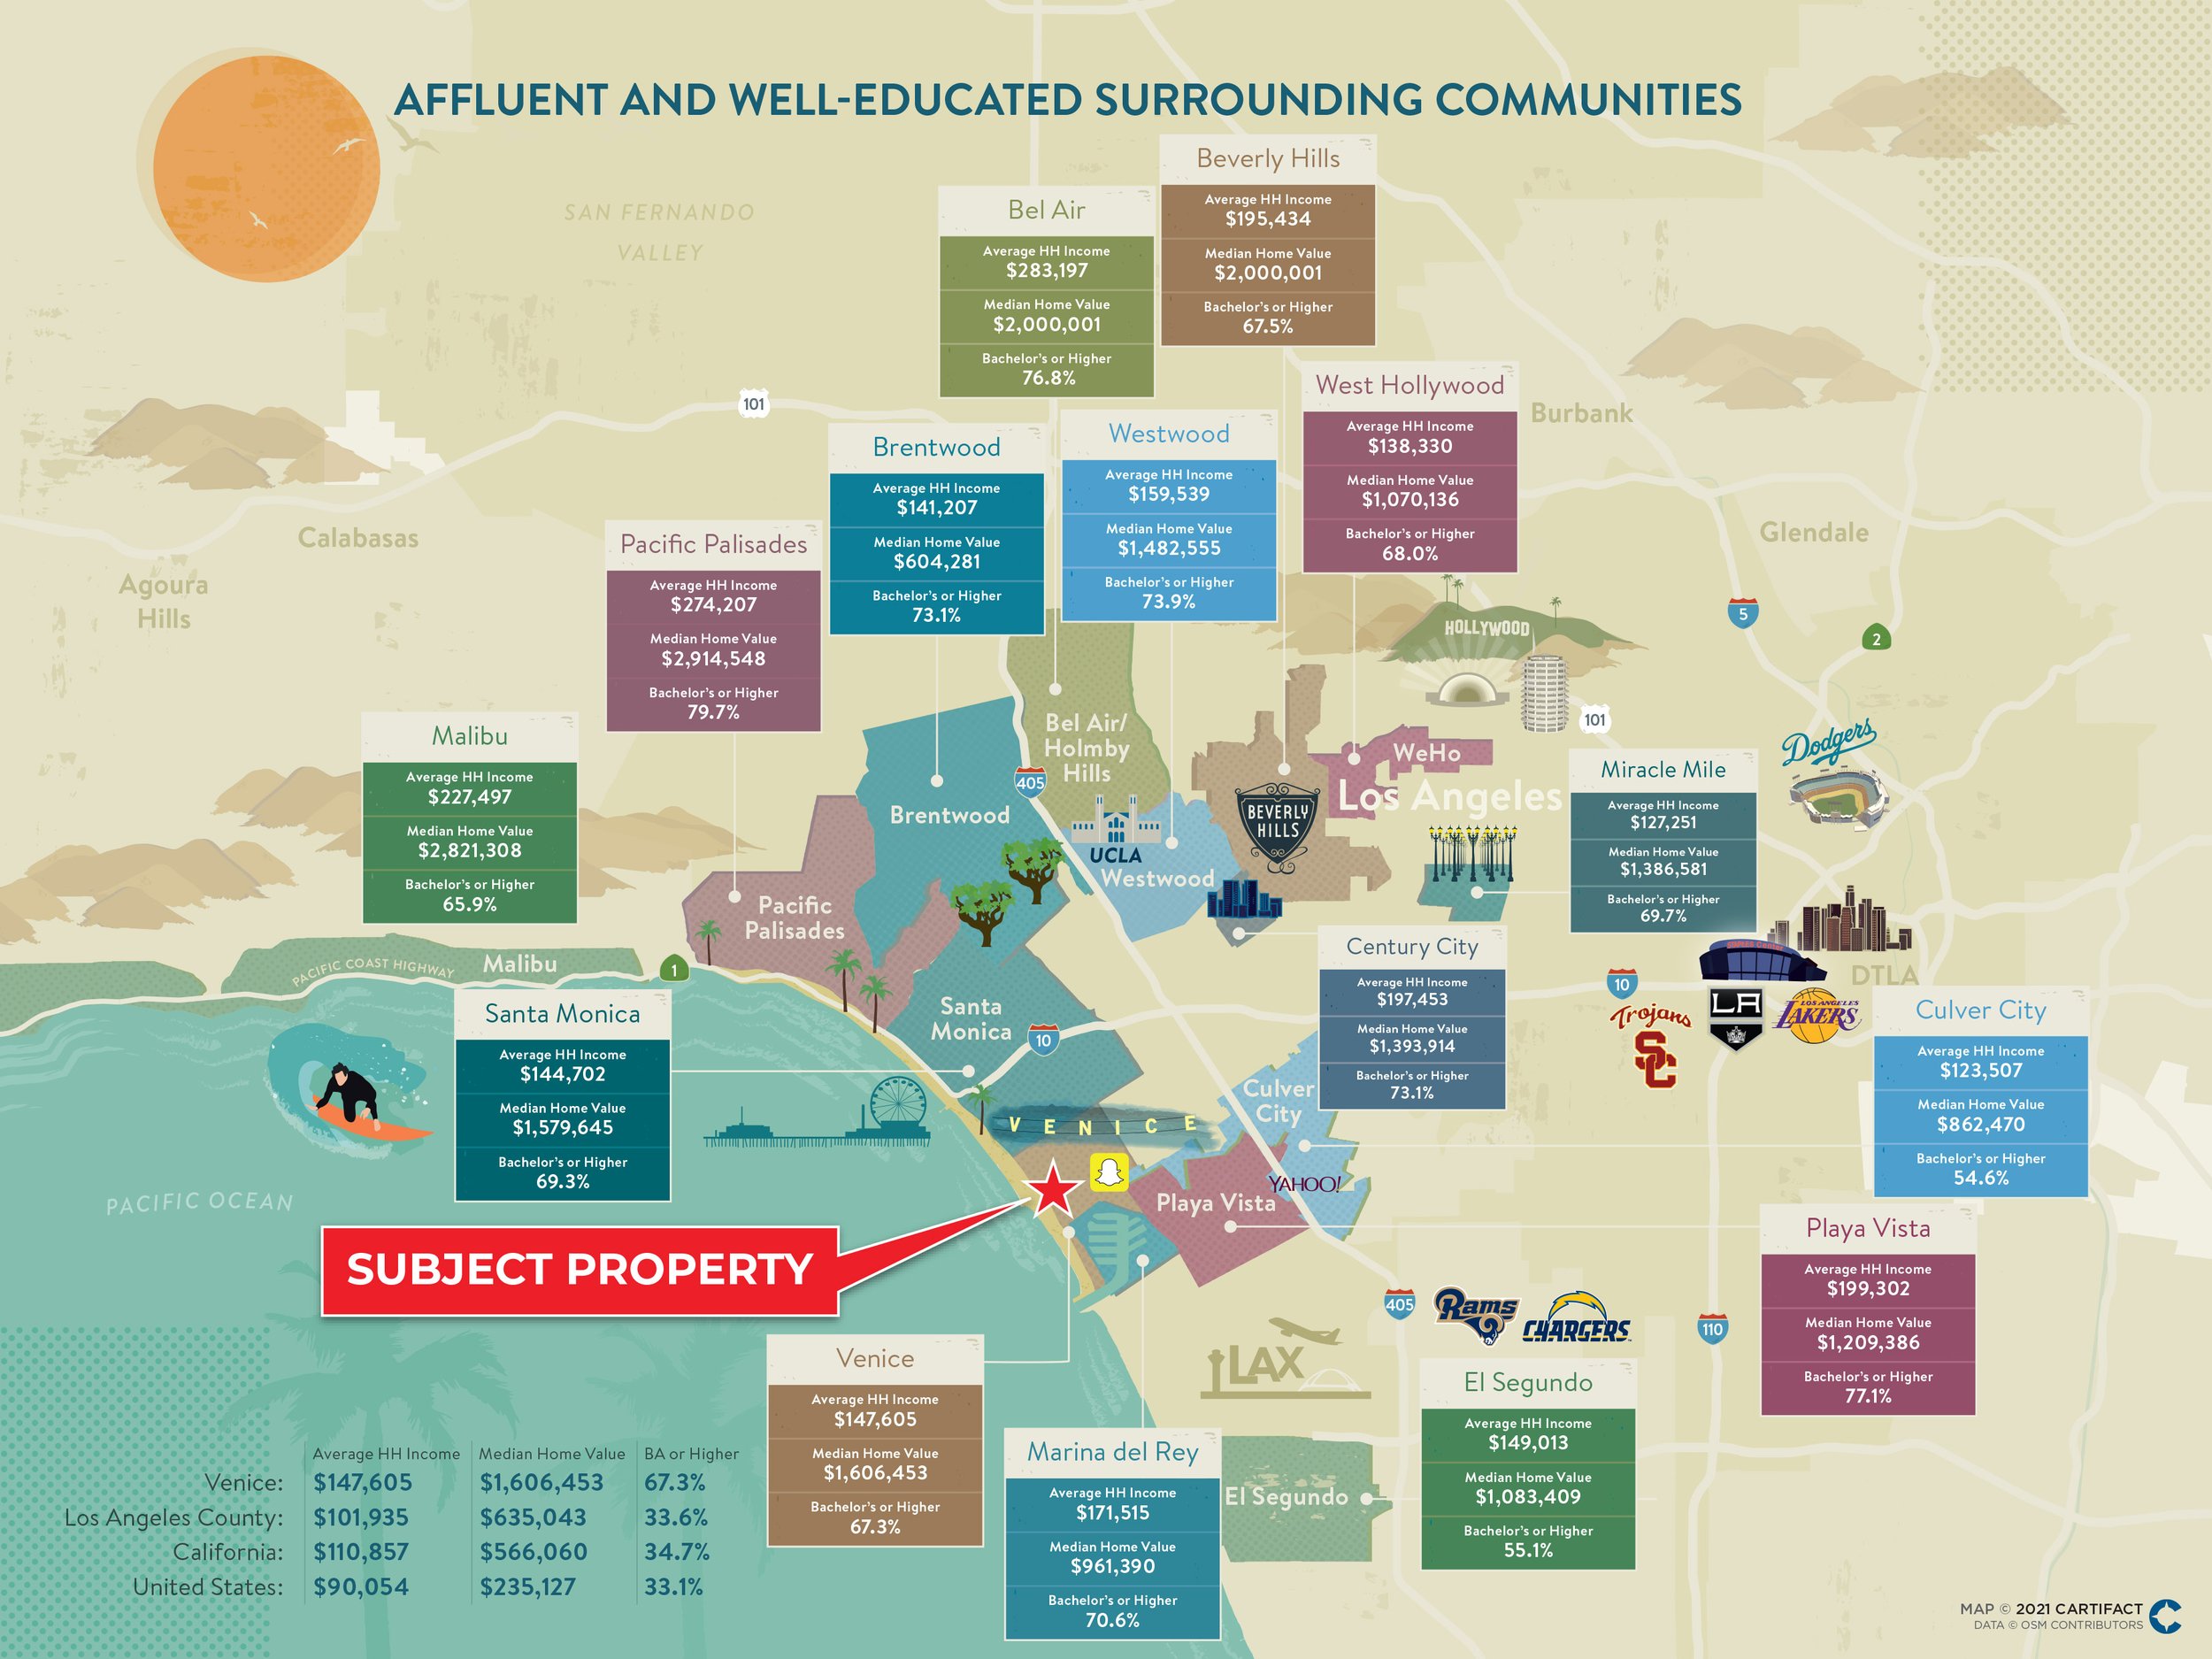
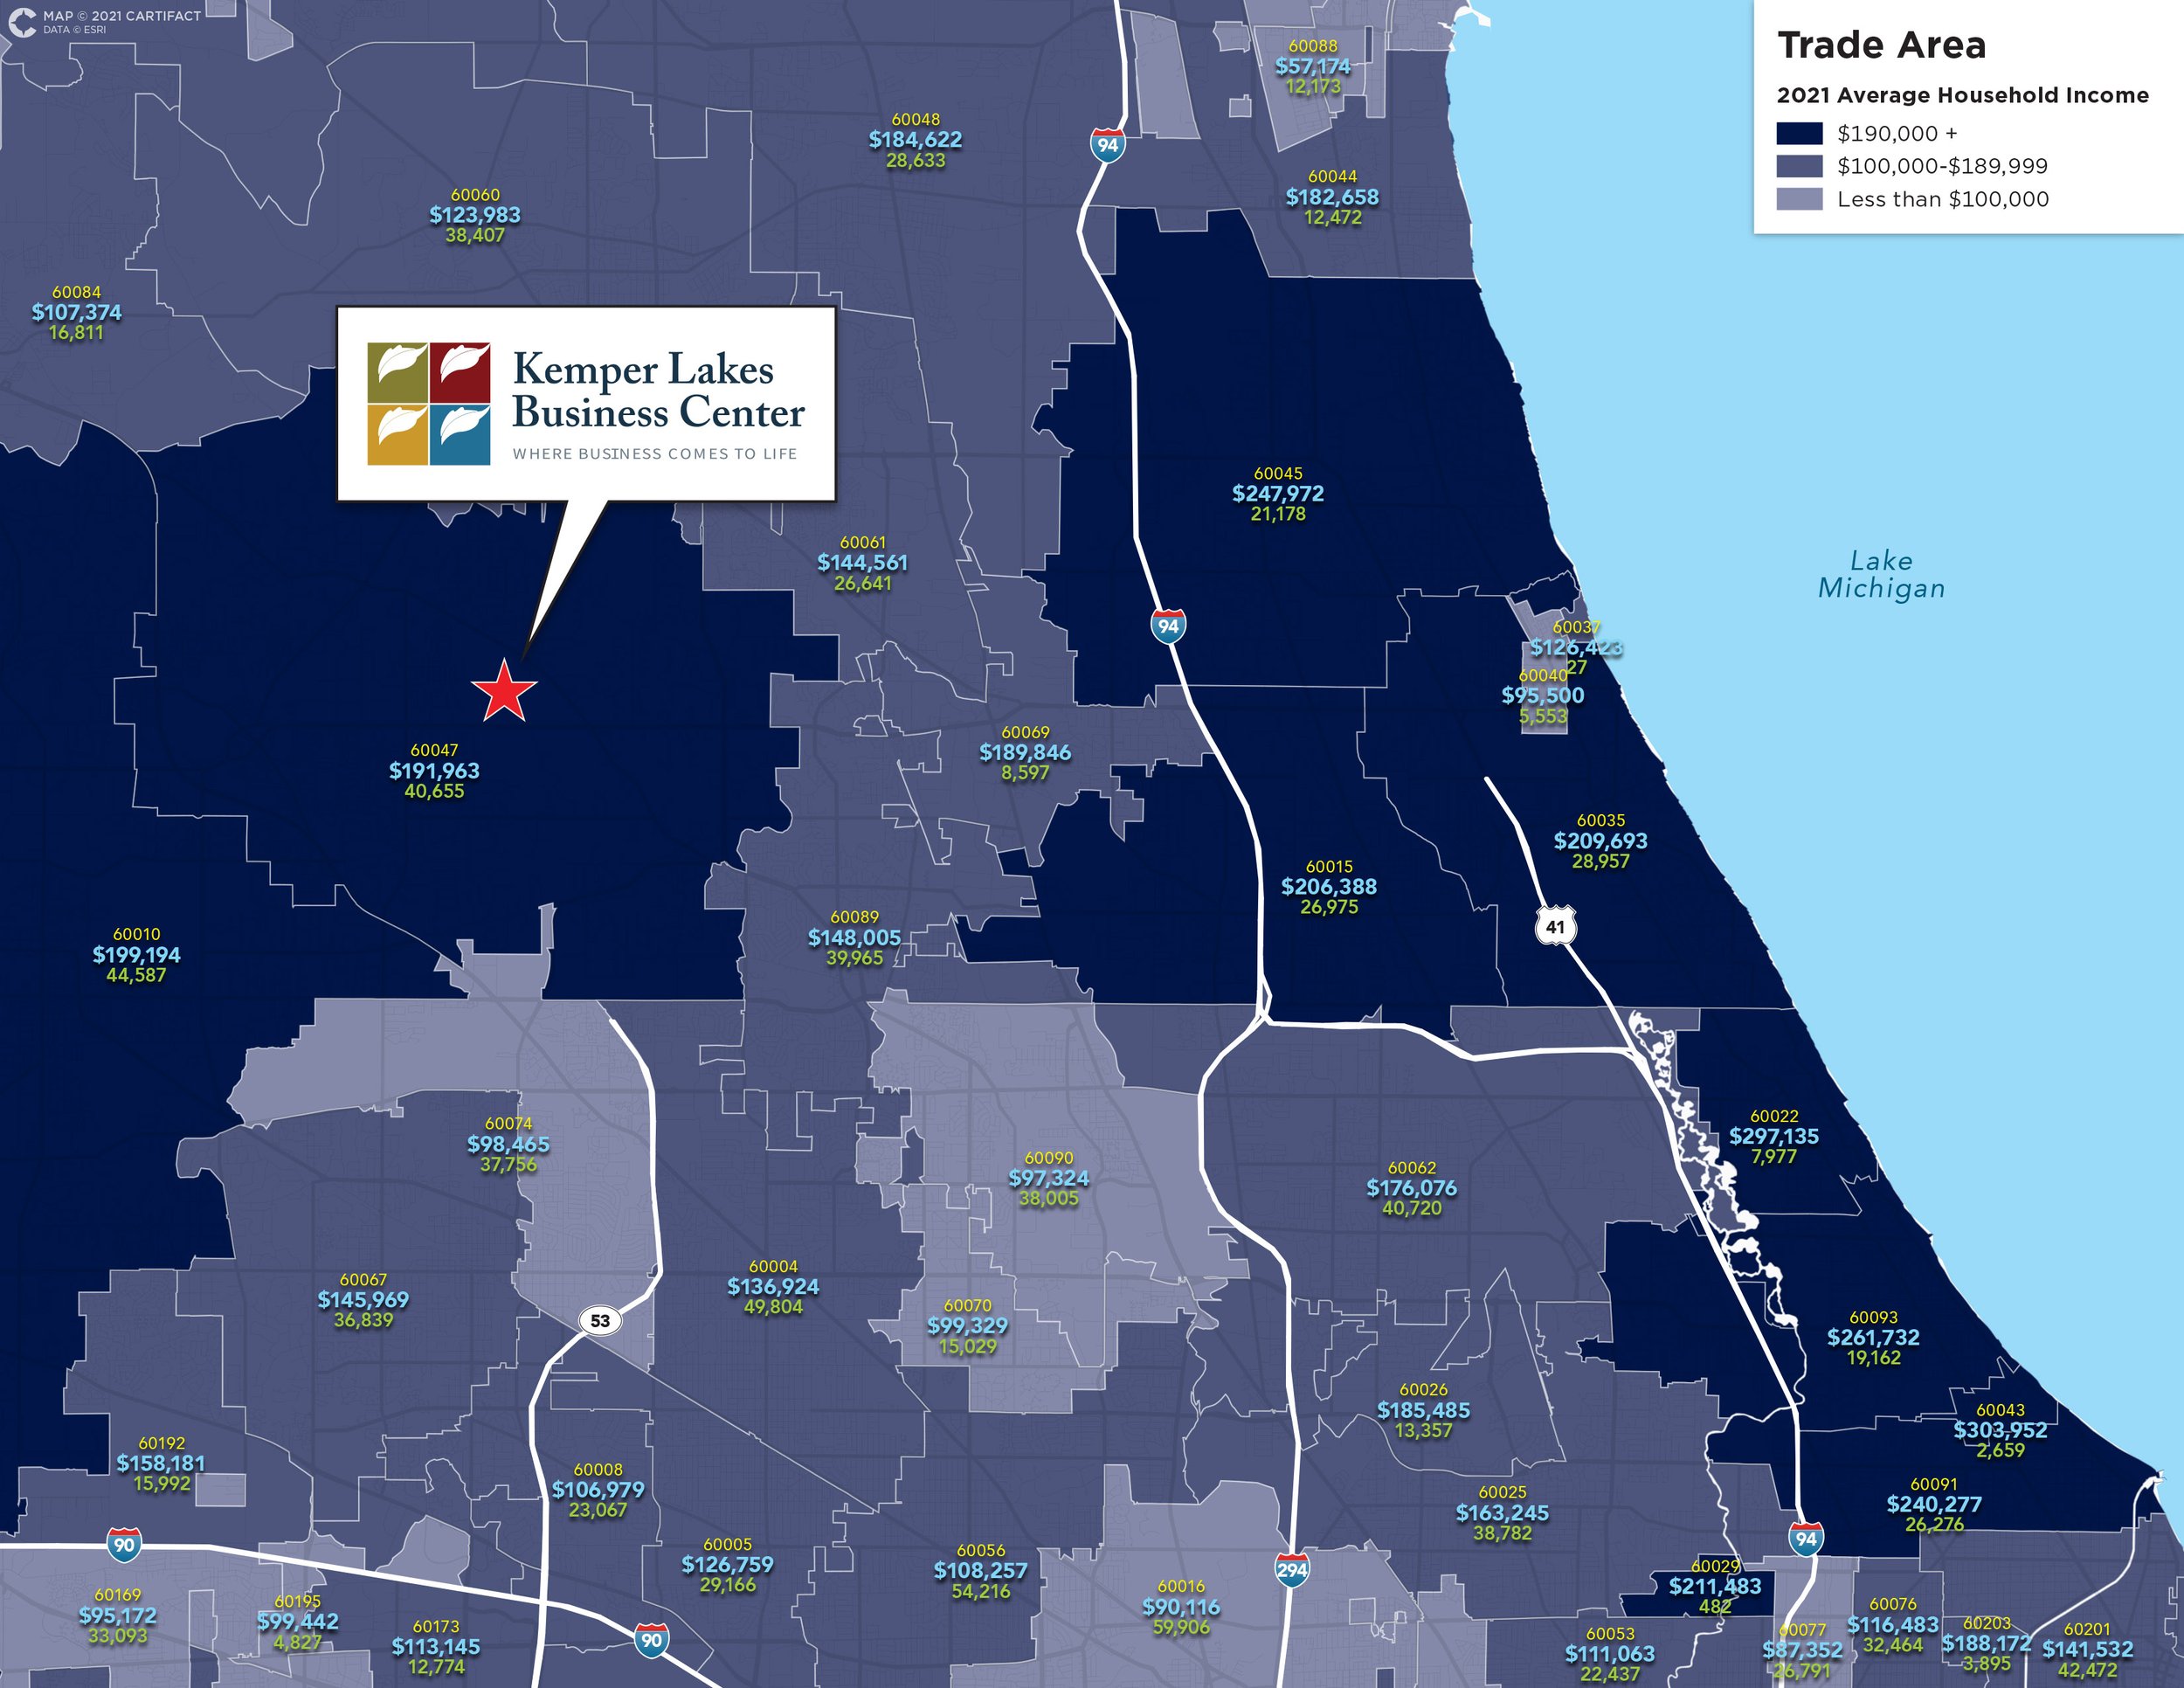
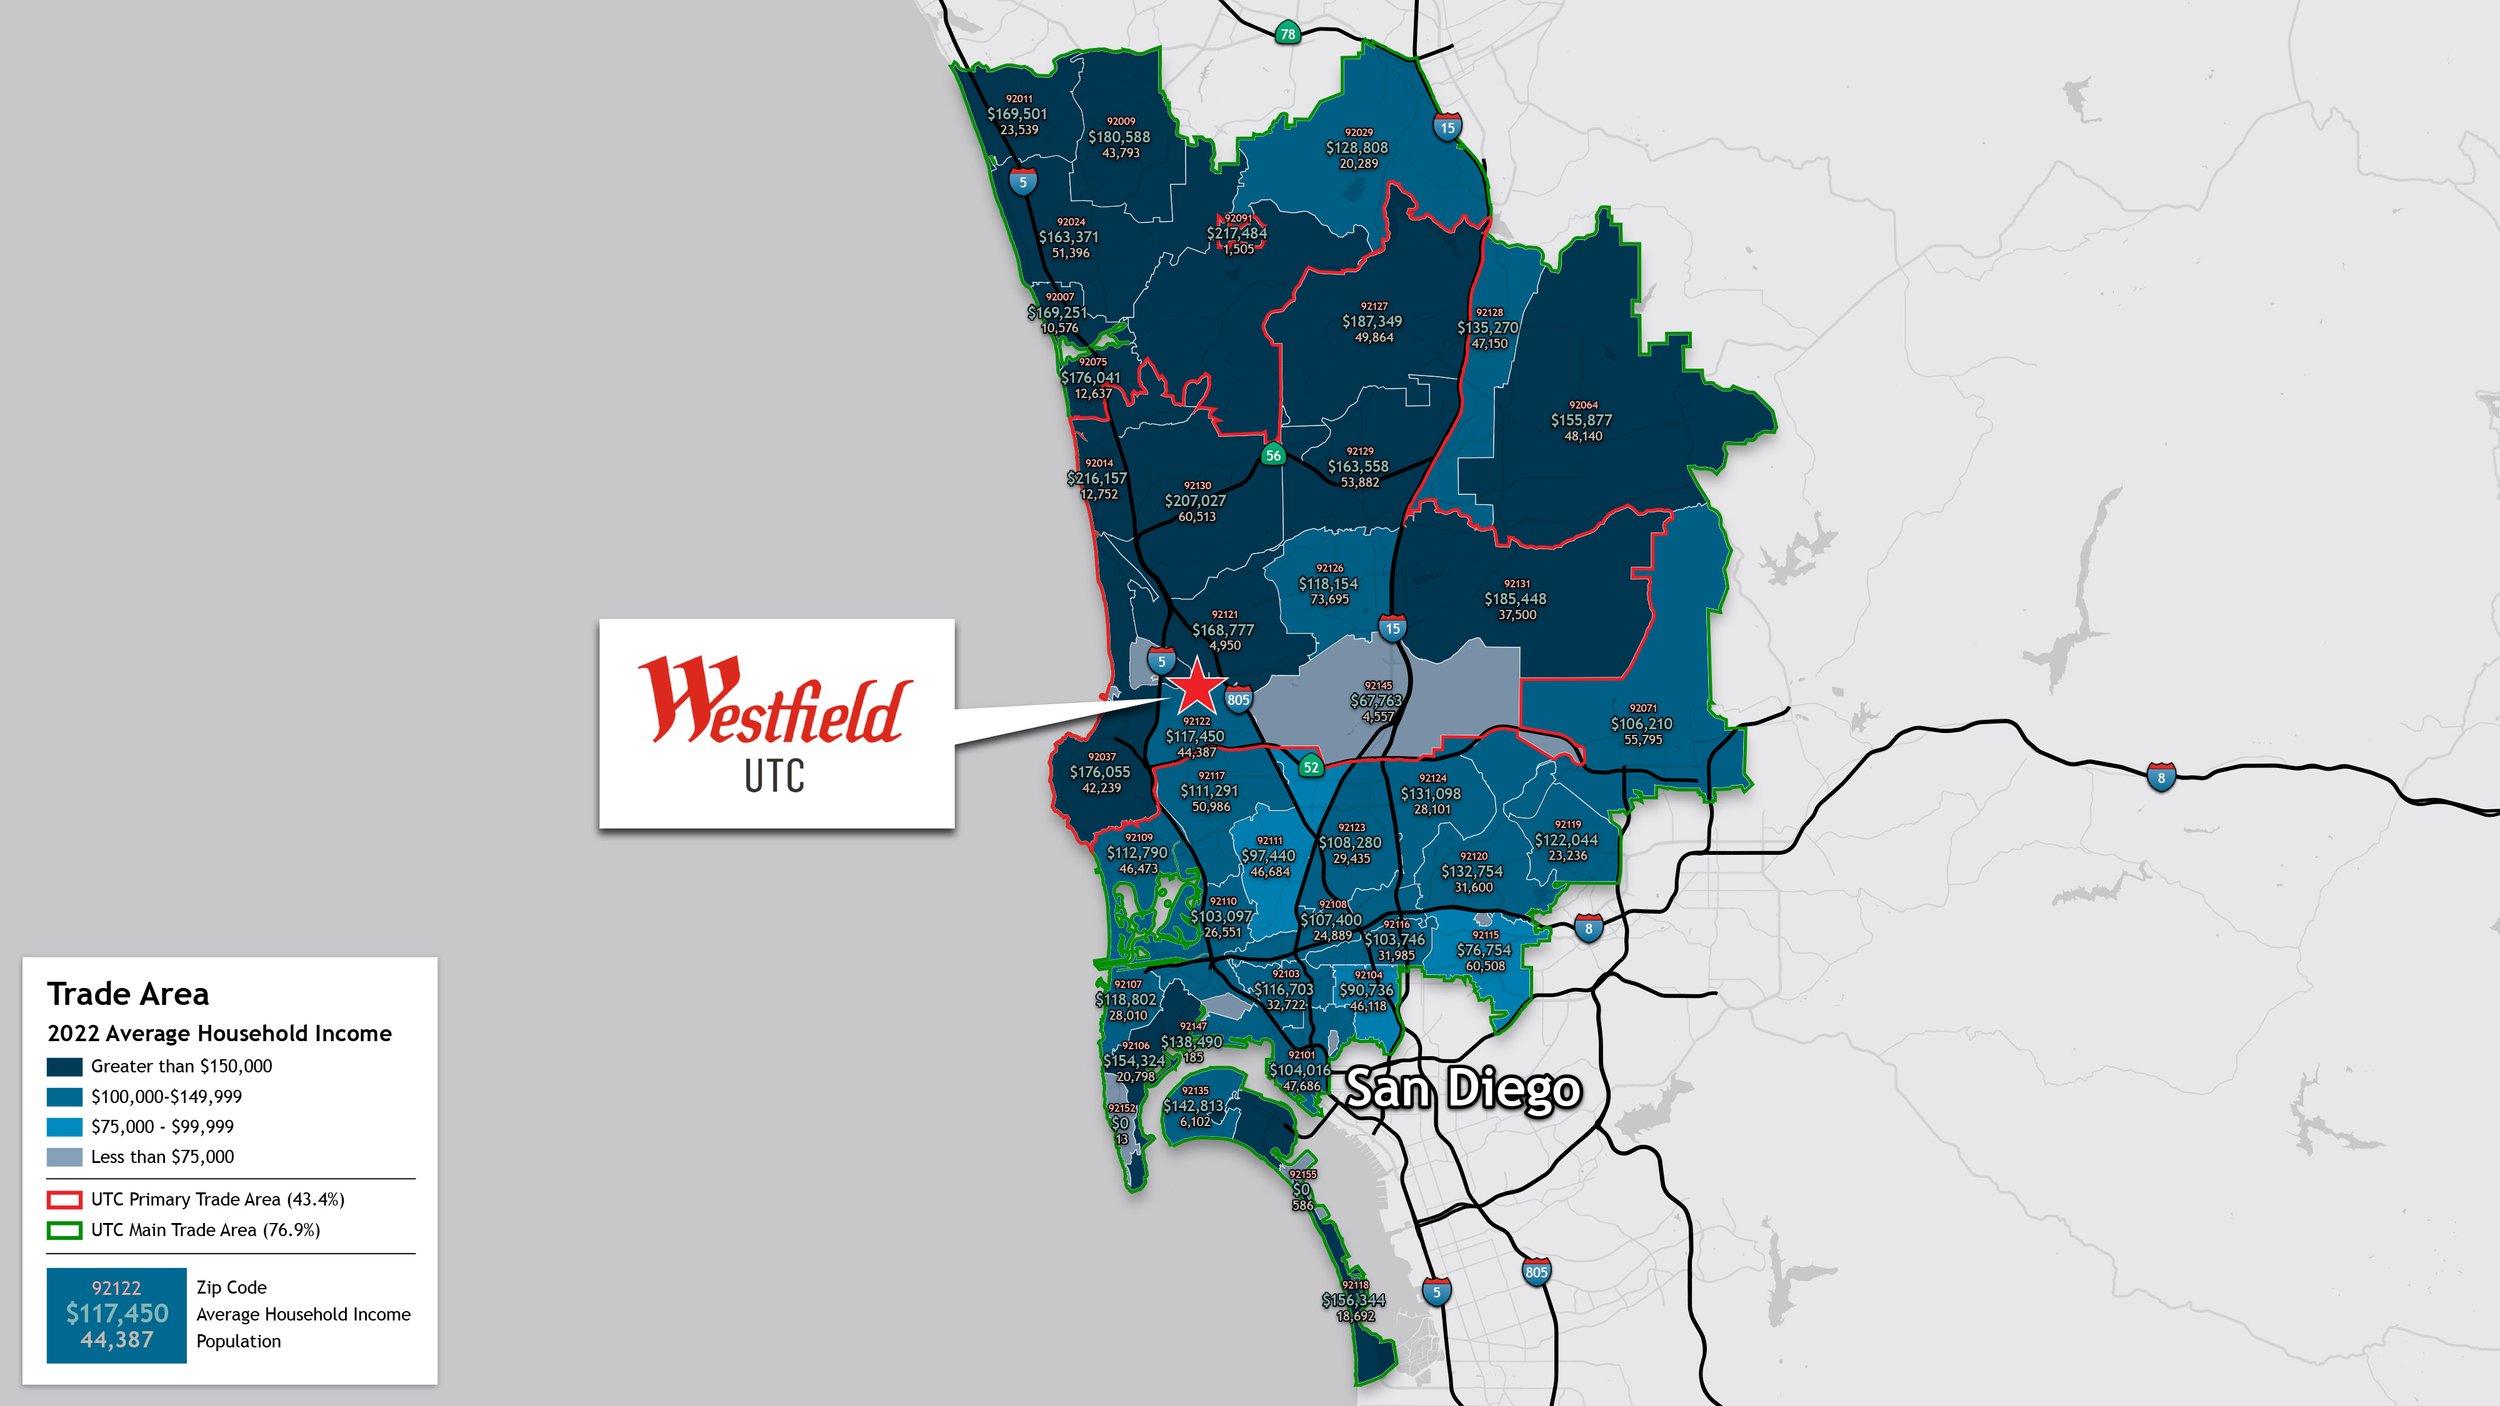
demographics
Used to visualize statistics such as population, household income, or educational attainment.

1
2
3
4
5
6
7
8
9
10
11
12
13
14
15
16
17
18
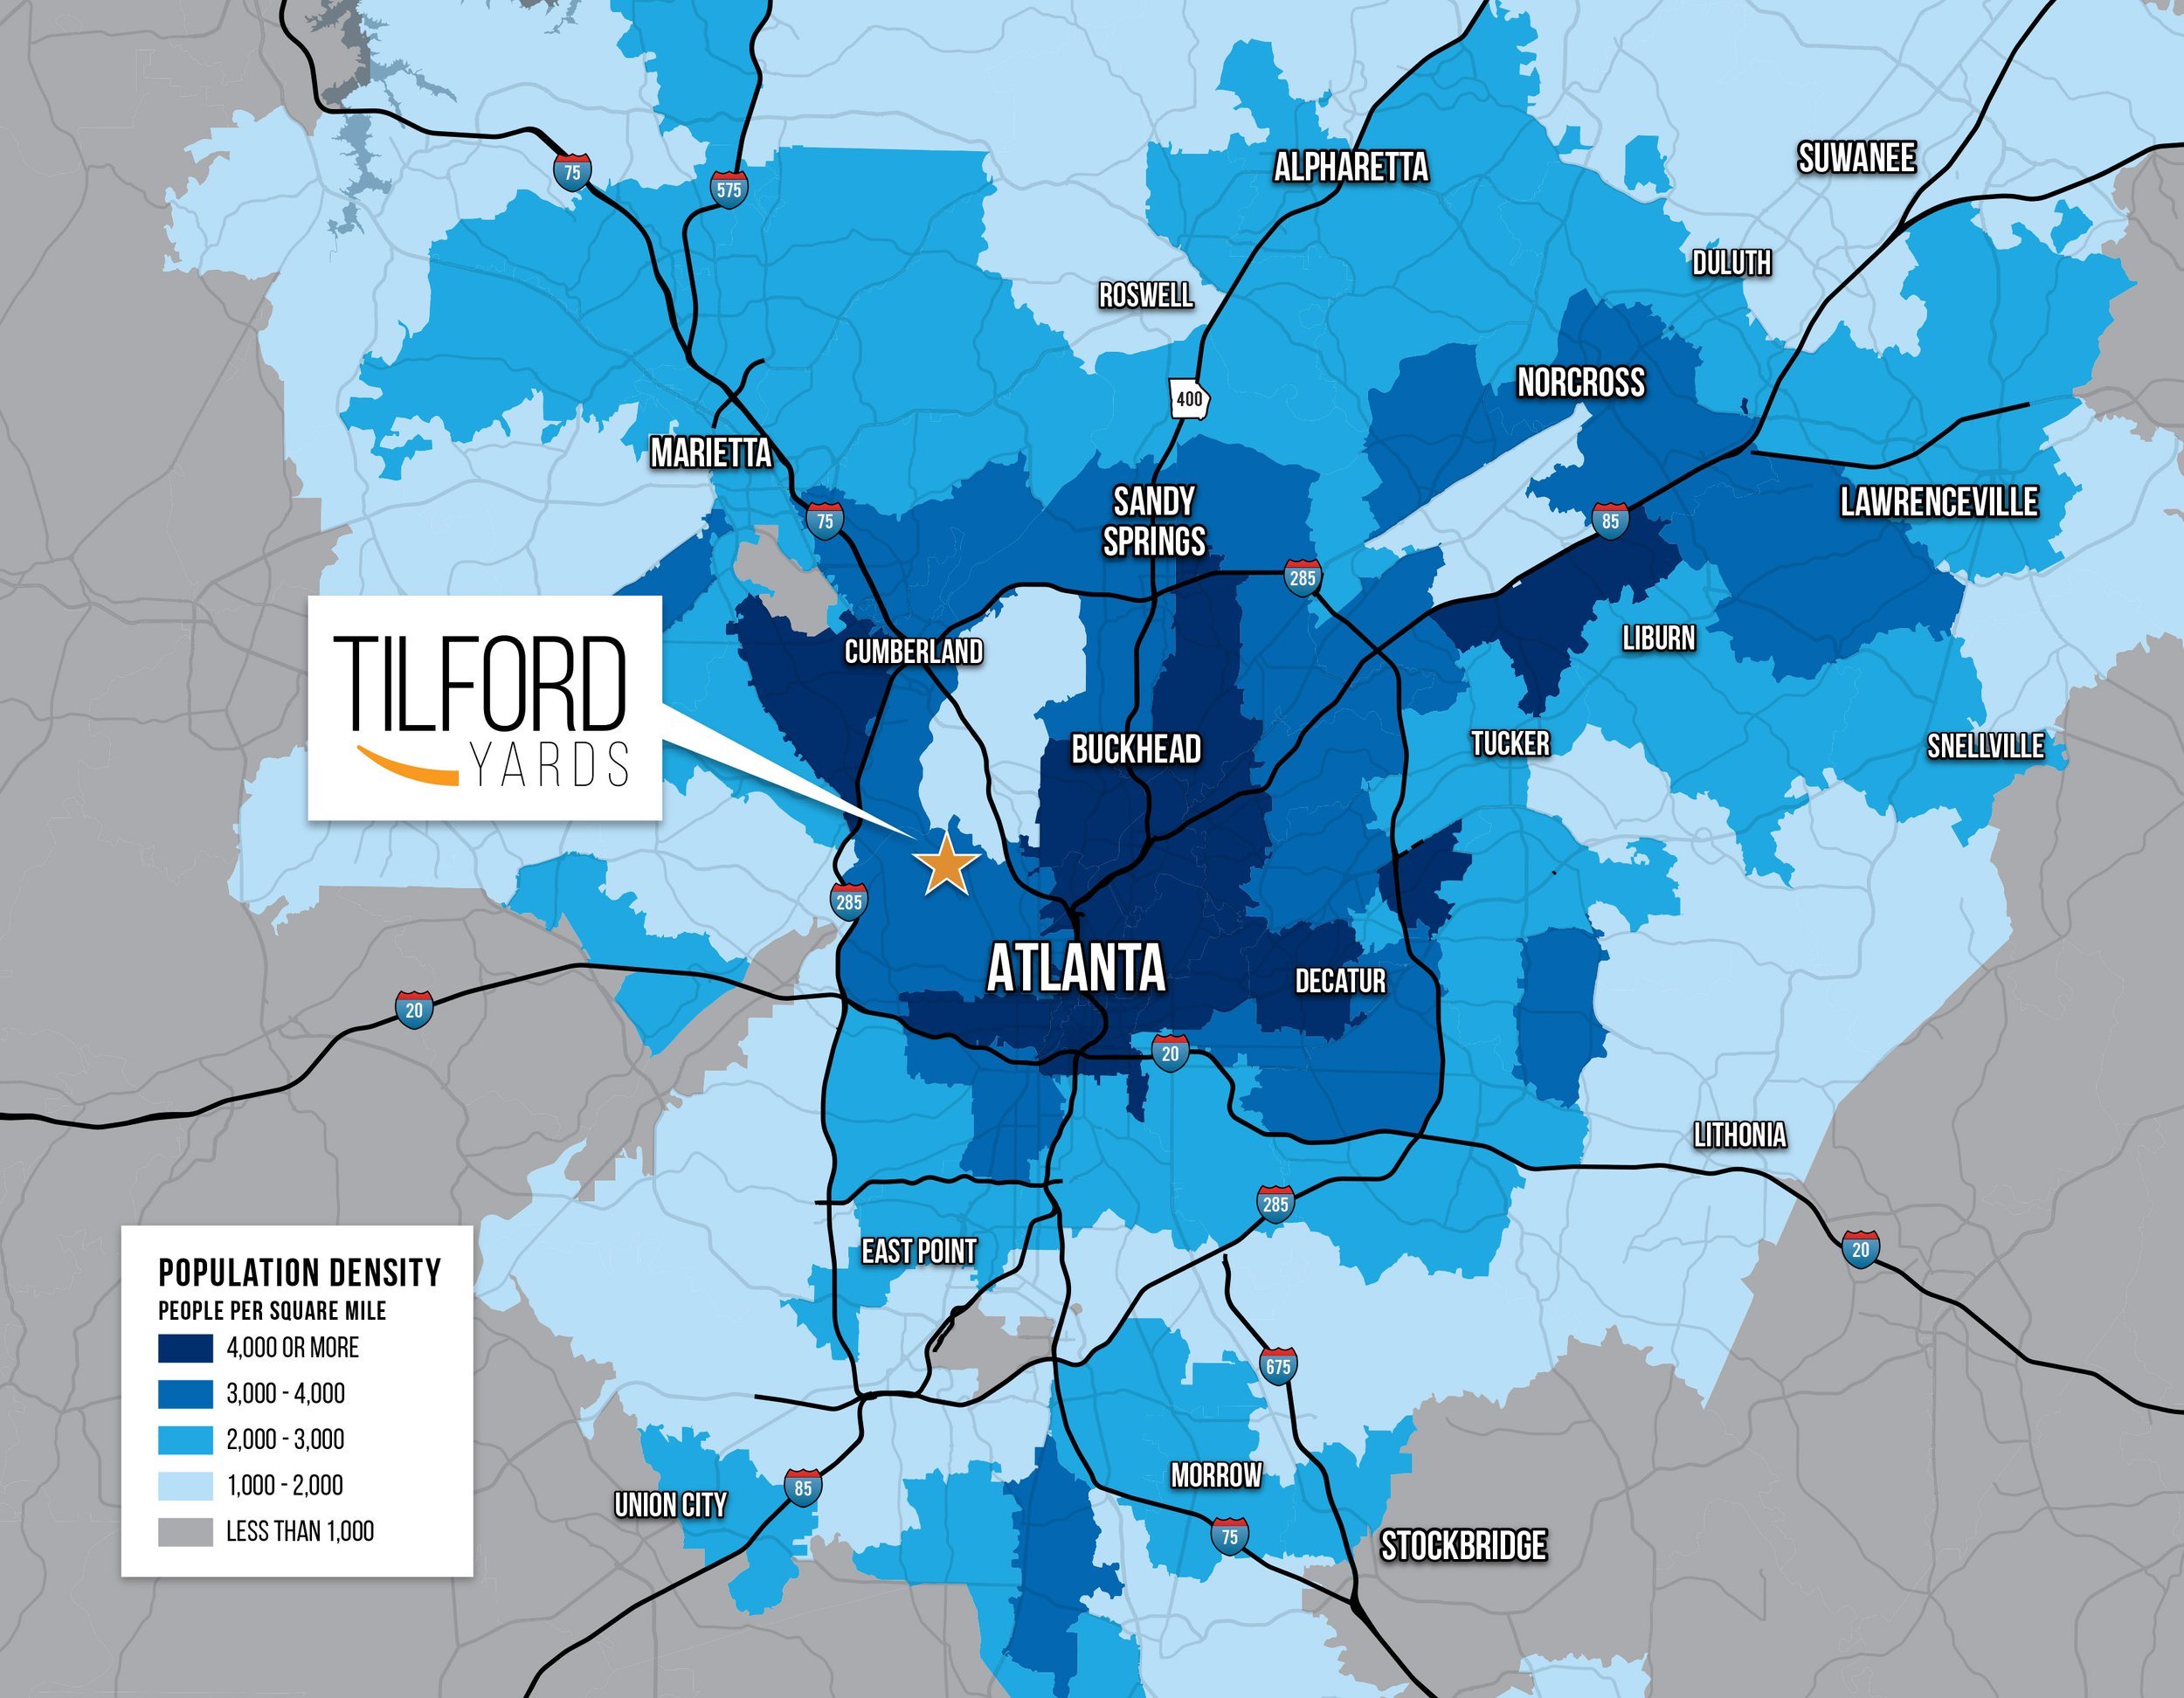
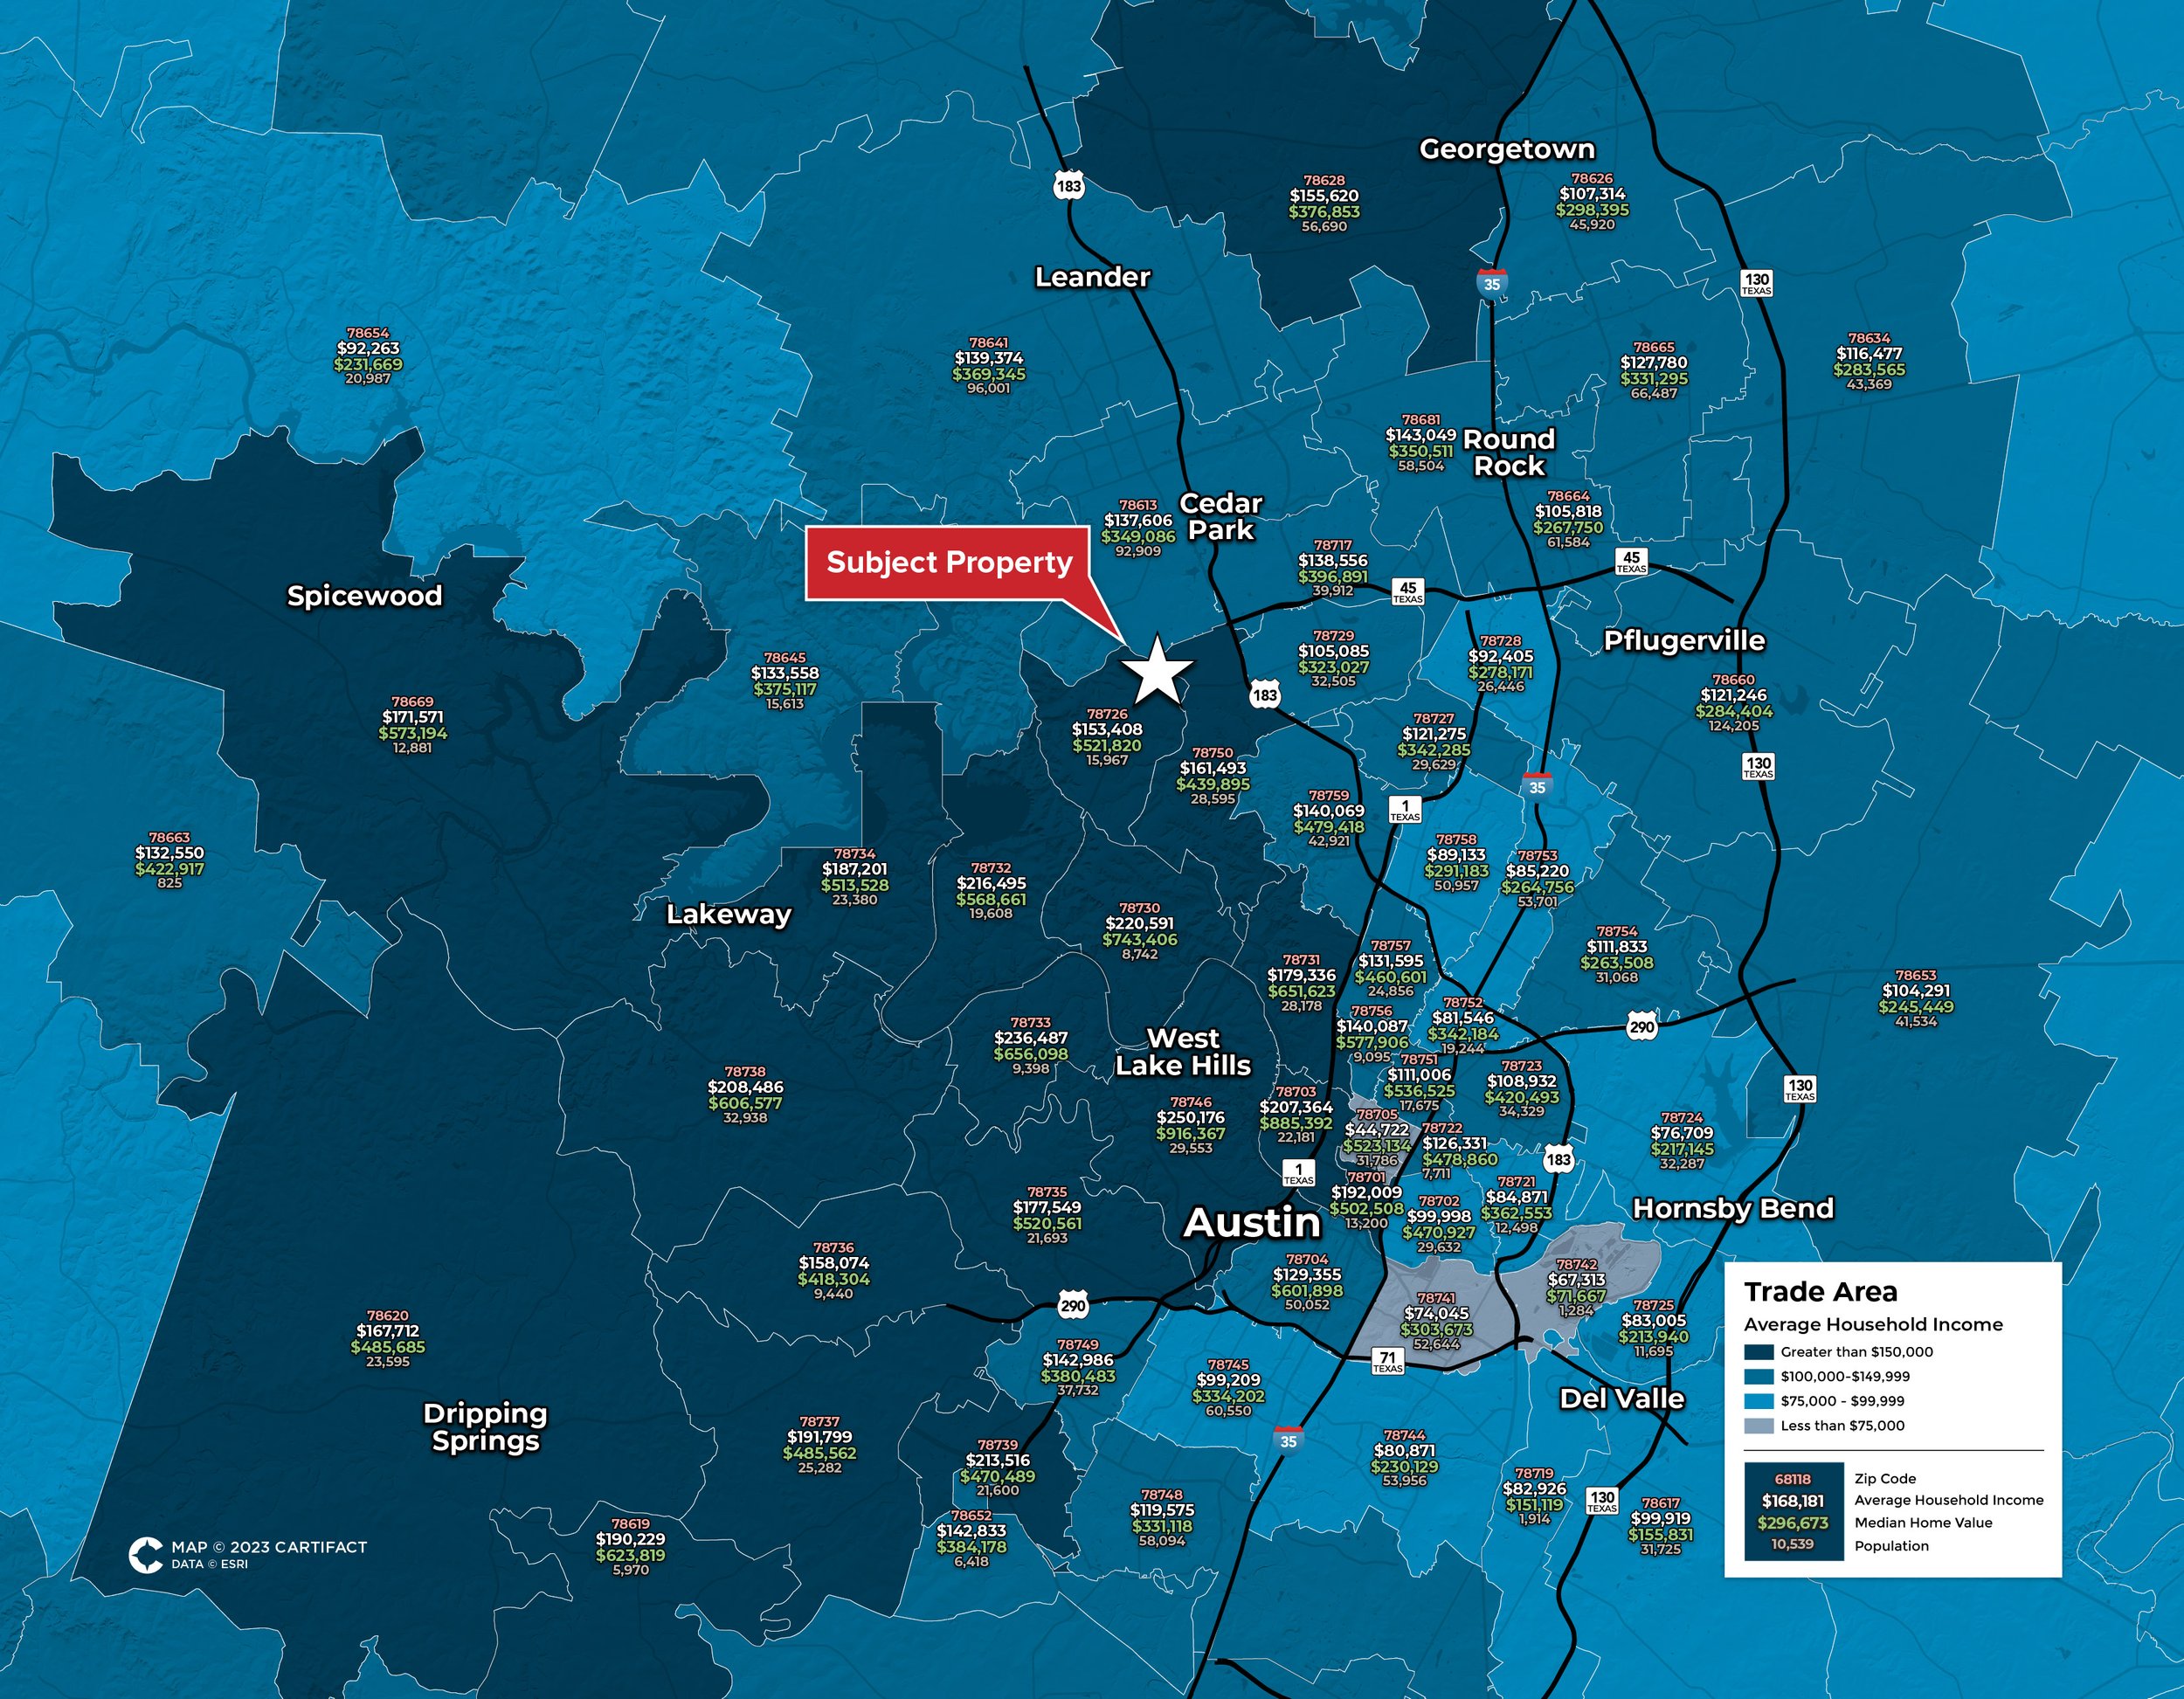
demographics
Used to visualize statistics such as population, household income, or educational attainment.